Slider starting in the middle of a chart
- Dominant language
- TypeScript
- Stars
- 15
- Forks
- 4
- PR merge metrics
- No merged PRs in 30d
Description
## I'm submitting a ...
Check one of the following options with "x" and add the appropriate label to the issue as well
[ ] Bug report

[x] Regression (behaviour that used to work and stopped working in a new release)
**Describe the Issue**
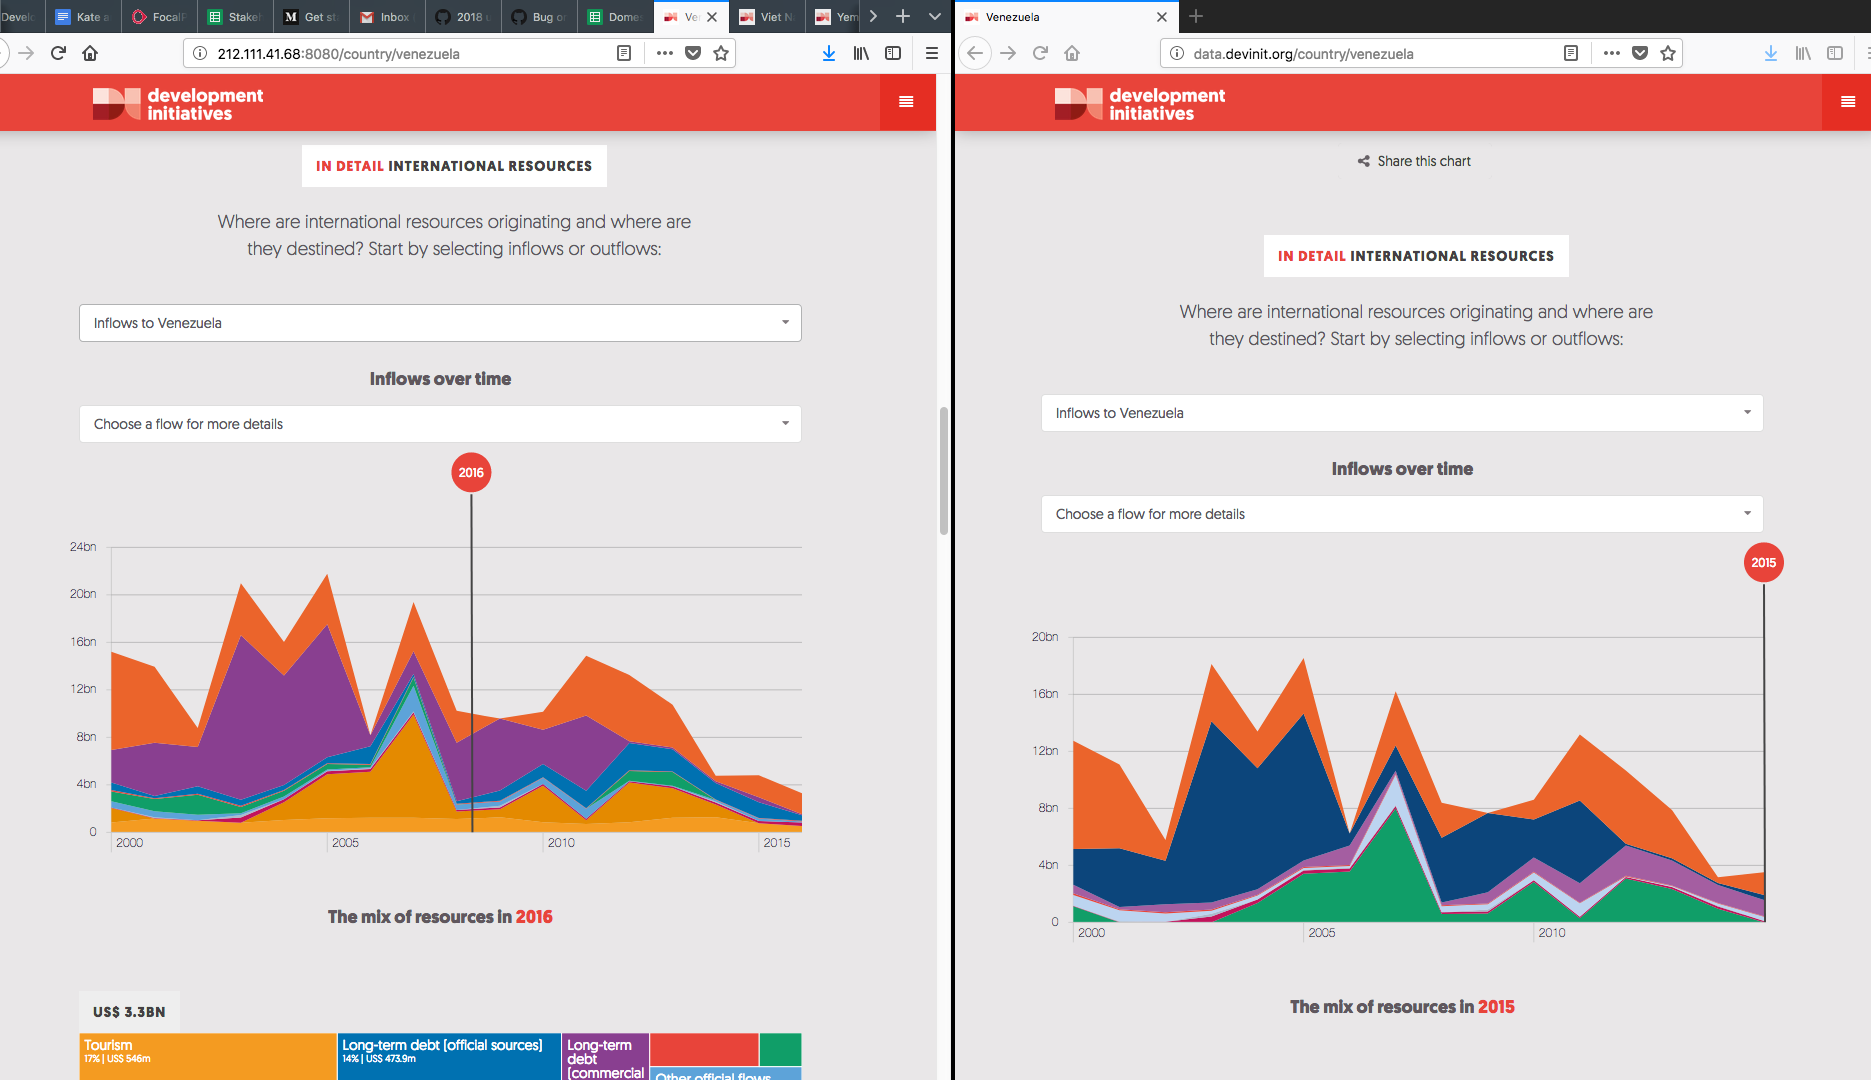
On staging when you arrive to several of the graphs the slider has the bubble for 2016 but is appearing at the centre of the chart
**To Reproduce**
Replace the content below with the steps to reproduce the behaviour.
1. Go to 'http://212.111.41.68:8080/country/venezuela'
2. Click on 'international resources'
3. Scroll down to 'inflows over time'
4. See error
**Expected Behaviour**
the slider should appear at 2016
**Screenshots/GIF**
This screen shot shows the correct live image next to staging.
**Desktop (please complete the following information):**
- OS:
- Firefox
**Smartphone (please complete the following information):**
- Device: [e.g. iPhone6]
- OS: [e.g. iOS8.1]
- Browser [e.g. stock browser, safari]
- Version [e.g. 22]
**Environment/Server:**
- [ ] Production

- [ x ] Staging

- [ ] Test

- [ ] Development
**Additional Context**
Add any other context about the problem here.
Requested Delivery Date: 08/10/2018
Contributor guide
No contributing guide indexed for this repository
Assessment
This issue has not been assessed yet.