Dask faster than Spark with a lot less iterations and better accuracy
- Dominant language
- Python
- Stars
- 951
- Forks
- 262
- PR merge metrics
- No merged PRs in 30d
Description
Hello,
I'm benchmarking k-means clustering Dask versus Spark.
Right now these are only benchmarks on my laptop, but I've some interesting results and I'm looking for an explanation before I further benchmark this algorithm on a cluster.
I've logged the execution time, model cluster predictions, iterations. Both benchmarks used the same data with 1.6 million rows.
The questions are:
- Why does Spark need a lot more iterations than Dask?
- Why is clustering less accurate in Spark than in Dask?
I'm unclear why those are different, because they both use the same underlying algorithm and have more or less the same standard parameter.
**Dask**
```python
KMeans(
n_clusters=8,
init='k-means||',
oversampling_factor=2,
max_iter=300,
tol=0.0001,
precompute_distances='auto',
random_state=None,
copy_x=True,
n_jobs=1,
algorithm='full',
init_max_iter=None,
)
```
**Spark**
I've set maxIter to 300 and reset the seed for every benchmark.
```python
KMeans(
featuresCol='features',
predictionCol='prediction',
k=2,
initMode='k-means||',
initSteps=2,
tol=0.0001,
maxIter=20,
seed=None,
distanceMeasure='euclidean',
)
```
Here you can see the duration of execution of each k-means clustering together with the iterations used to get a result. Spark is a lot slower than Spark on the overall calculation, but needs also a lot more iterations. Interestingly Spark is faster per iteration (the slope of a regression line) and faster on initialization (the y-intercept of the regression line). For the Spark benchmarks one can also make out a second line which I couldn't yet explain.

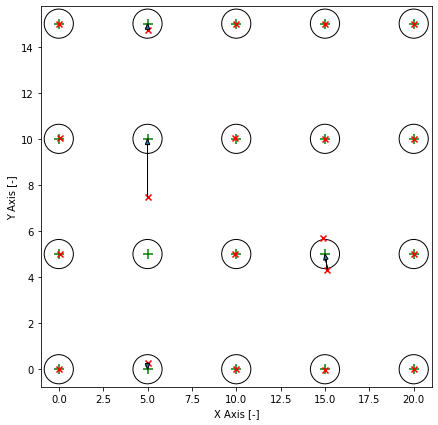
The training data is equally spaced grid. The circles around the cluster centers are the standard deviation. Clusters are overlapping and it is impossible to get a hundred percent accuracy. The red markers are the predicted cluster centers and the arrow shows their correspoding cluster center. In this example the clustering is not correct. One cluster was on the wrong spot and two predicted cluster centers share one cluster center. I can make these plots for all models.
The graph on the right makes everything much weirder. Apperently the Spark implementation is less accurate than the Dask implementation. Also you can see the distribution of the duration and iterations much butter (These are seaborn boxenplots).

I'm using Anaconda for Windows and PySpark 2.4.5 and Dask 2.5.2.
I filed this issue for [Dask](https://github.com/dask/dask-ml/issues/686) and [Spark](https://issues.apache.org/jira/browse/SPARK-32107).
Best regards
Julian
Contributor guide
Assessment
This issue has not been assessed yet.