Logarithmic correlogram view
@rossant is already working on this.
Since Jun 14, 2019.
- Dominant language
- Python
- Stars
- 430
- Forks
- 187
- Avg merge
- 2h 31m
- Merged PRs (30d)
- 2
Description
from @nsteinme (https://github.com/kwikteam/phy-contrib/issues/123) :
There is some fair amount of wasted space in the correlogram view: all of the data shown is simply mirrored (both within ACG and the whole CCGs in upper vs lower triangle). Here is a suggestion to add something useful there: make the right-hand side of the plot show a log-timescale ACG/CCG. Using a log scale enables you to visualize long-timescale patterns that are of considerable interest but hard to see when zoomed in enough for sorting. Since the information is currently already duplicated, nothing is lost. It could look like this, for an ACG:
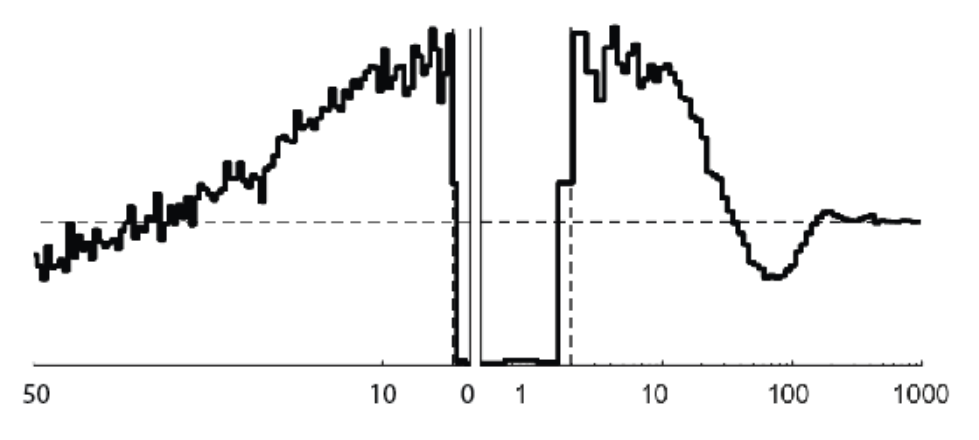
Ideally you don't want to just put the same ACG on a log scale, but also use larger and larger bins for longer time delays so there is some de-noising. We could discuss the details if it seems like it's going to happen.
cc @kdharris101
Contributor guide
No contributing guide indexed for this repository
First steps
- Read the whole issue, then the project's contributing guide.
- Comment on the issue to say you are picking it up — it saves two people doing the same work.
- Fork the repository and make your change on a branch.
- Open a pull request that references the issue number.
Assessment
This issue has not been assessed yet.