codestates / codestates/ds-blog
[김현재] advanced to do 도전
- Dominant language
- No language data
- Stars
- 2
- Forks
- 4
- PR merge metrics
- No merged PRs in 30d
Description
### 1. for loop - advanced to do 도전
```javascript
# Initializing list
list_01 = [ 1, 6, 3, 5, 3, 4 ]
list_02 = [ 1, 6, 3, 5, 3 ]
# for loop을 이용하여 두 개의 리스트 안에 4가 있는지 없는지 print 하는 코드를 작성하세요
# 1. 이번에 새로 작성한 for loop 버전
count = 0
for j in list_01:
if j == 4 :
count =1
# j 가 4면(=list_01에 4가 있으면) count는 1이다.
if count == 1:
print('4 in list_01')
else:
print('없습니다_list_01')
# count==1이 아니라면(즉, list_01에 4가 없으면) '없습니다'를 출력한다.
count2 = 0
for i in list_02:
if i == 4 :
count2 = 1
if count2 == 1:
print('4 in list_02')
else:
print('없습니다_list_02')
```
> 결과값
> 4 in list_01
없습니다_list_02
### 2. for loop - numpy 버전으로 수행
```javascript
import numpy as np
list1 = np.array(list_01)
list2 = np.array(list_02)
if np.size(np.where(list1==4)) != 0 :
print('4 in list_01')
else:
print('4 없음_list_01')
if np.size(np.where(list2==4)) != 0 :
print('4 in list_02')
else:
print('4 없음_list_02')
# np.size(np.where(list2==4))
```
> 결과값
> 4 in list_01
없습니다_list_02
### 3. 위 함수 표현 다르게 진행함.
```javascript
# 위 코드 역할을 하는 함수를 작성해 보세요.
x = list1
y = list2
def find(x, y) :
if np.size(np.where(x==4)) != 0 :
print('4 in list_01')
else:
print('4 없음_list_01')
if np.size(np.where(y==4)) != 0 :
print('4 in list_02')
else:
print('4 없음_list_02')
print(find(list1, list2))
```
> 결과값
> 4 in list_01
> 4 없음_list_02
> None
### Q. 위 코드에서 출력시 none은 왜 나오는건지 궁금함..^^;;
### 4. lambda, filter 를 써봄
```javascript
list_03 = [4, 5, 8, 9, 10]
# 위 list element 중 8보다 큰 숫자가 몇 개가 있는지 코드로 작성해 보세요.
# filter 함수, len 함수 사용, lambda 사용
len(list(filter(lambda x: x>8, list_03)))
```
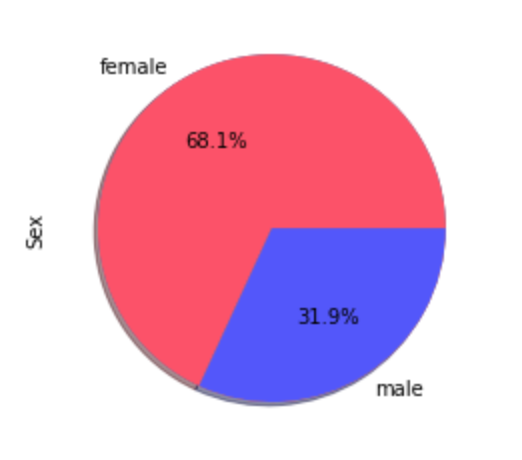
### 5. 시각화 (1) - 생존자 남녀 비율 원그래프
```javascript
# 'https://web.stanford.edu/class/archive/cs/cs109/cs109.1166/stuff/titanic.csv' 자료를 불러와 dataframe으로 만들어 보세요
df3 = pd.read_csv('https://web.stanford.edu/class/archive/cs/cs109/cs109.1166/stuff/titanic.csv', sep=',')
df3
```
```javascript
# 1. 생존자 중 남녀 비율 원그래프
import matplotlib.pyplot as plt
ratio = [68.12, 31.87]
colors = ['#FE5066', '#514FFE']
df_Survived['Sex'].value_counts().plot.pie()
plt.pie(ratio, autopct='%.1f%%', shadow=True, colors = colors)
plt.show()
```
> 결과값
>
### 6. 시각화 - (2) 연령 구간별, 생존자들의 수치 구하고, 그래프로 표현하기.
```javascript
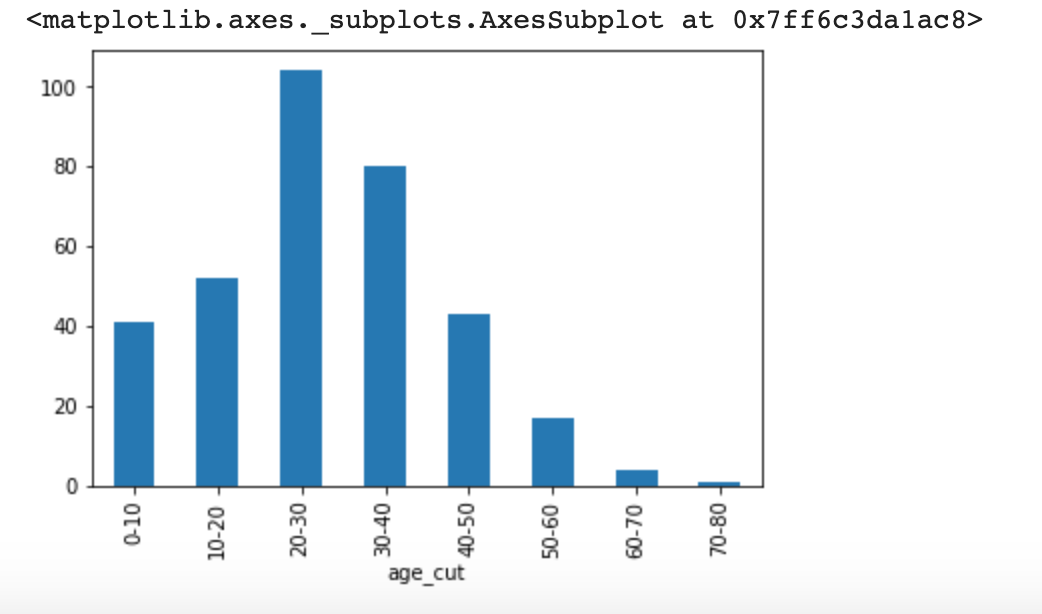
# 연령 구간별, 생존자들의 수치 구하고, 그래프로 표현하기.
# 1단계: 연령 구간별로 나눈다.
print(df_Survived.describe())
# # Age의 최소값 0.42, 최대값 80, 구간을 10 단위로 나누기로 한다.
df_Survived['age_cut'] = pd.cut(df_Survived['Age'], bins=[0, 10, 20, 30, 40, 50, 60, 70, 80],
labels = ['0-10', '10-20', '20-30', '30-40', '40-50', '50-60', '60-70', '70-80'])
df_Survived[['Age', 'age_cut']]
df_Survived['Age'].groupby(df_Survived["age_cut"]).count().plot(kind="bar")
#생존자 중 연령별 명수 막대그래프 완성
# 1위 20-30대, 2위 30-40대
```
>결과값
>
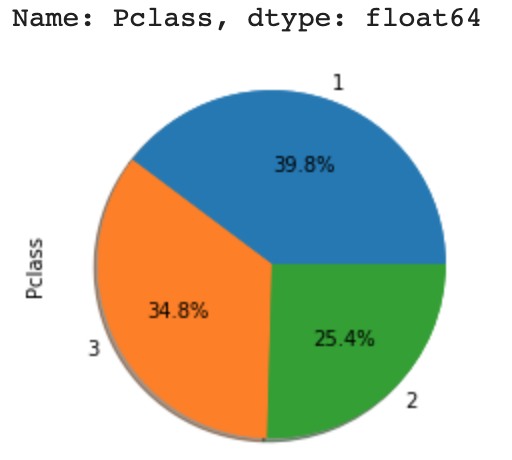
### 7. 시각화 (3) - 생존자 Pclass 별 비중 원그래프
```javascript
df_Survived['Pclass'].value_counts().plot.pie()
print((df_Survived['Pclass'].value_counts()/df_Survived['Pclass'].count())*100)
ratio_p = [39.76, 34.79, 25.43]
plt.pie(ratio_p, autopct='%.1f%%', shadow=True)
plt.show()
```
>결과값
Contributor guide
No contributing guide indexed for this repository
Assessment
This issue has not been assessed yet.