codestates / codestates/ds-blog
[최근후] day 4 advanced To-Do (데이터 시각화 시도)
- Dominant language
- No language data
- Stars
- 2
- Forks
- 4
- PR merge metrics
- No merged PRs in 30d
Description
## 난 rate를 구해서 알아보기 쉽게 만들고 싶은데 아직은 어떻게 하는지 모르겟다...!
```py
# 타이타닉 데이터 불러오기
import pandas as pd
titanic = pd.read_csv('https://web.stanford.edu/class/archive/cs/cs109/cs109.1166/stuff/titanic.csv')
titanic.head()
```
```py
# 생존자들만 보기
survived = titanic[titanic["Survived"]==1]
survived
```
```py
# 남자 생존자 vs 희생자
titanic[titanic.Sex=='male'].Survived.value_counts().plot(kind='barh', title='Male Survived')
```

```py
# 여자 생존자 vs 희생자
titanic[titanic.Sex=='female'].Survived.value_counts().plot(kind='barh', title='Female Survived')
```

**위의 두 그래프를 보면 여자는 생존자가 희생자보다 많지만 남자는 희생자가 생존자보다 많다. 이 데이터를 더 알아보기쉽게 만드는 방법을 알아봐야겠다 ㅎㅎ 아래에 있는 그래프들도 모두 두가지로 보여지는데 마찬가지다....!**
```py
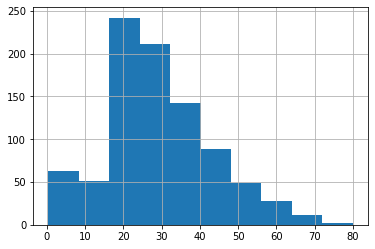
# 전체 탑승자들의 연령 그래프
titanic['Age'].hist()
```
```py
# 생존자들의 연령 그래프
survived['Age'].hist()
```
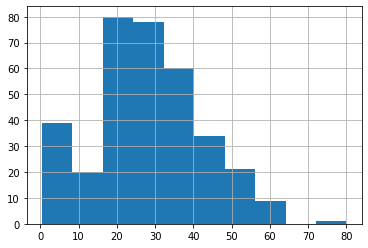
**위에 말했듯이 이것들을 더 이해하기쉽게 보기위해선 이 두 그래프가 동시에 보여져야 할것같다.**
```py
# 전체 탑승자들의 class
titanic.groupby("Pclass")["Pclass"].count().plot(kind='barh', title='People by class')
```

```py
# 생존자들의 class
survived.groupby("Pclass")["Pclass"].count().plot(kind='barh', title='People Survived by class')
```

**전체 탑승자를 보면 class 3 에 탑승한 사람들이 다른 두클래스에 비해 2배이상 많지만 생존자는 그렇지 않다..!**
Contributor guide
No contributing guide indexed for this repository
Assessment
This issue has not been assessed yet.