codestates / codestates/ds-blog
[조보현]Section02 Project_COVID-19 in South Korea : 입원기간의 차이에 대한 모델링
- Dominant language
- No language data
- Stars
- 2
- Forks
- 4
- PR merge metrics
- No merged PRs in 30d
Description

----------------
----------------

# 사용한 데이터셋
[DS4C: Data Science for COVID-19 in South Korea](https://www.kaggle.com/kimjihoo/coronavirusdataset)
원본 데이터셋(영어) 설명접기/펼치기
# 1. The Lists of Data Table
## What is this dataset (Detailed Description)
- https://www.kaggle.com/kimjihoo/ds4c-what-is-this-dataset-detailed-description
### 1) Case Data
- **Case**: Data of COVID-19 infection cases in South Korea
### 2) Patient Data
- **PatientInfo**: Epidemiological data of COVID-19 patients in South Korea
- **PatientRoute**: Route data of COVID-19 patients in South Korea (currently unavailable)
### 3) Time Series Data
- **Time**: Time series data of COVID-19 status in South Korea
- **TimeAge**: Time series data of COVID-19 status in terms of the age in South Korea
- **TimeGender**: Time series data of COVID-19 status in terms of gender in South Korea
- **TimeProvince**: Time series data of COVID-19 status in terms of the Province in South Korea
### 4) Additional Data
- **Region**: Location and statistical data of the regions in South Korea
- **Weather**: Data of the weather in the regions of South Korea
- **SearchTrend**: Trend data of the keywords searched in NAVER which is one of the largest portals in South Korea
- **SeoulFloating**: Data of floating population in Seoul, South Korea (from SK Telecom Big Data Hub)
- **Policy**: Data of the government policy for COVID-19 in South Korea
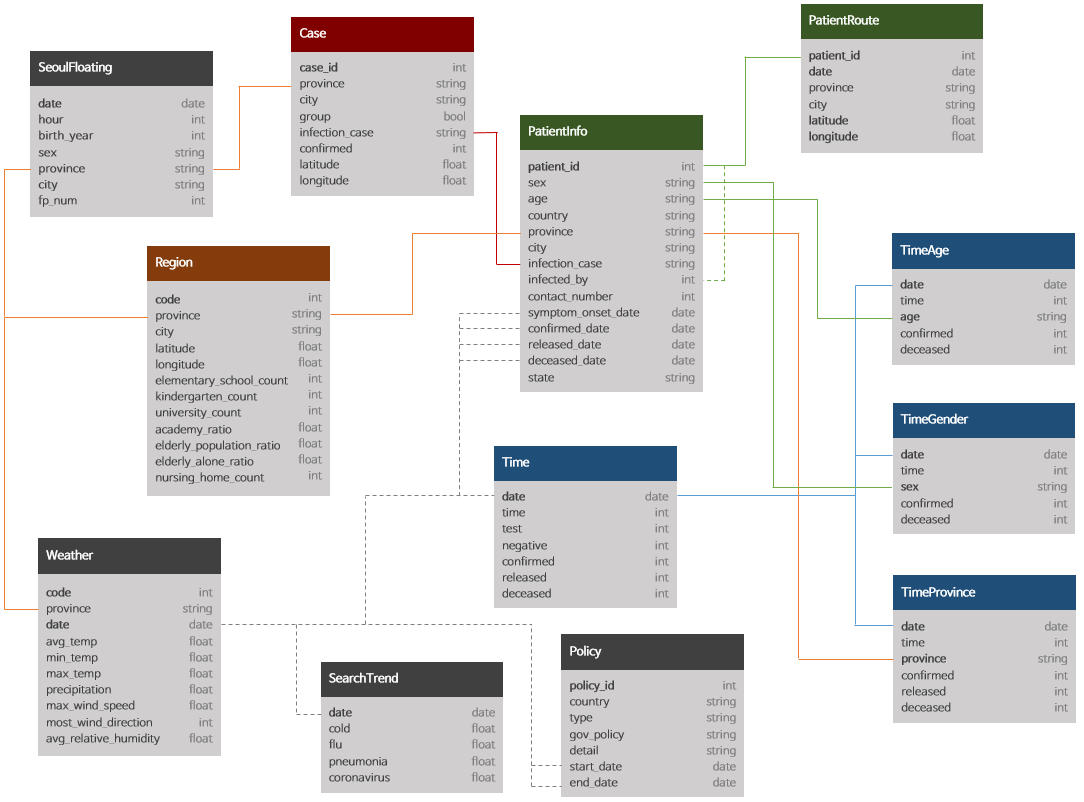
# The Structure of our Dataset
- What color means is that they have similar properties.
- If a line is connected between columns, it means that the values of the columns are partially shared.
- The dotted lines mean weak relevance.
----------------
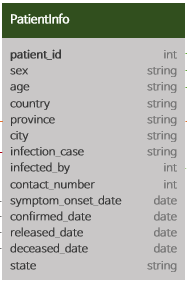
### 현재 `Section02 Project`에서 사용 할 데이터 : 환자 데이터(Patient Data)
- PatientInfo: 대한민국 COVID-19 환자의 역학 데이터
- PatientRoute: 대한민국 COVID-19 환자의 경로 데이터(현재 사용 불가)
데이터를 정하기 전에 해야할 작업들
# Steps of Data Wrangling :
> 데이터 분석이라는 요리를 내놓기 위해 데이터셋이라는 재료를 다듬는 과정
1. Discovering (탐색) : 데이터를 파악, 변수간의 상관관계 이해
- 도메인 지식
- 데이터분포 파악
- 어떤 데이터가 필요한지/필요없는지 확인
2. Cleaning (정리) : 분석/모델의 성능에 방해가 될만한 요소를 처리
- 결측치/이상치 처리
- 잘못된 데이터 처리
3. Structuring/Enriching (구조화/다양하게)
- 데이터 통합/ 인코딩
- 새로운 피쳐 만들기
### 데이터셋 설명
- patient_id : 환자 고유 번호
- sex: 성별
- age: 나이대
- country: 나라
- province: 00도/시(지역)
> ex) 경기도, 충청남도 etc
- city: 대도시명
> ex) 강서구, 중랑구 etc
- infection_case: 전염된 사례
> ex) 해외 유입, 환자와 접촉 etc
- infected_by: 누구(patient_id)에게 감염되었는가
- contact_number: 전화번호 뒷자리
- symptom_onset_date: 증상이 시작된 날짜
- confirmed_date: 확진 받은 날짜
- released_date: 퇴원한 날짜
- deceased_date: 사망 날짜
- state: 현재 상황
----------------
----------------
# 문제의 정의
- 이번에 만들 모델은 입원 기간이 평균보다 많을지 적을지를 예측하는 모델이다.
> 해당 문제를 하게된 이유 ?
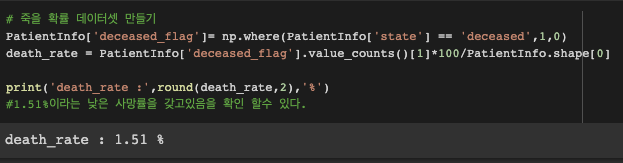
~처음에 "내가 한국에 살면서 죽을 확률은 몇프로일까?" 계산하는 모델링을 하려했습니다.~
~아무리 막 만들어도 90%를 넘을 극악치에 다른 타겟을 탐색하기 시작..~
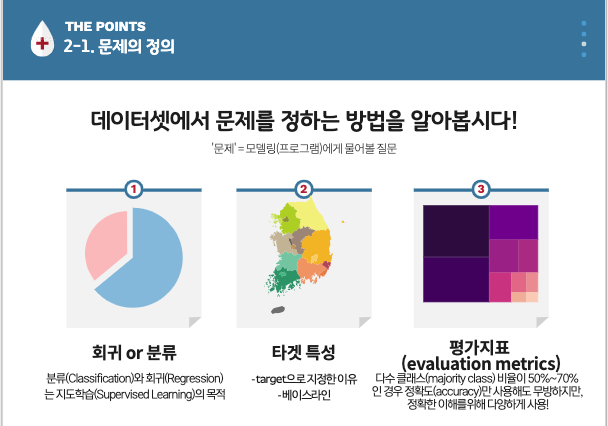
## 분류(Classification) or 회귀(Regression)?
> 평균 보다 높을지 낮을지 예측하는 것이다 보니 **이진 분류 (Binary classification)** 모델이다
## 타겟으로 사용할 특성을 선택
- 환자의 입원 기간을 타겟으로 하였다.
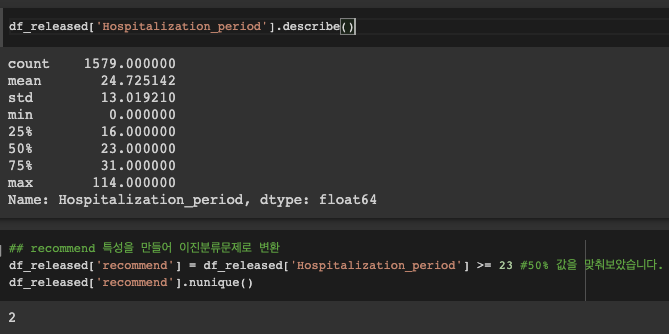
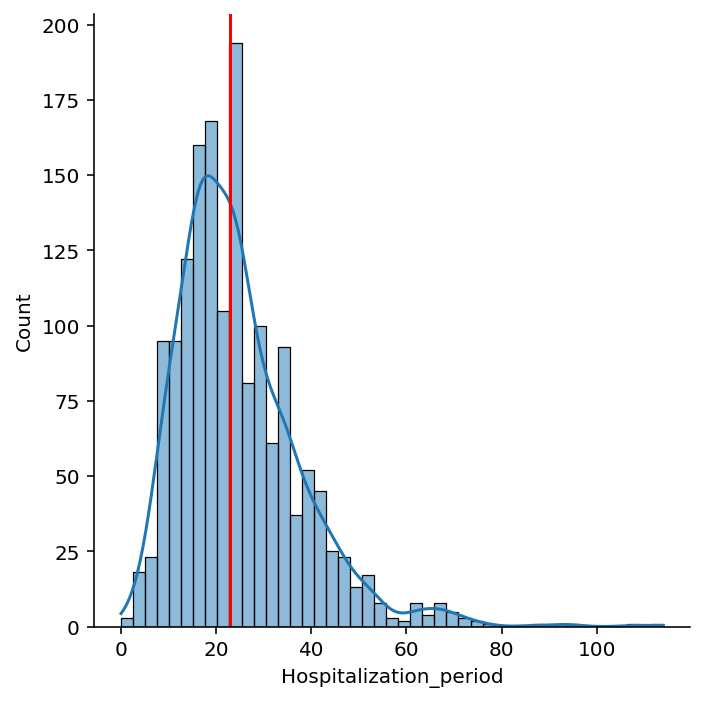
> why? 입원 기간이 평균보다 많을지 적을지를 예측해야하기 때문이다.
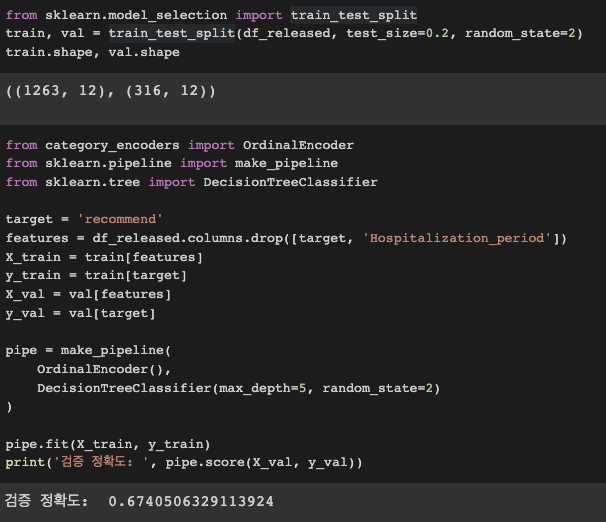
### 문제에 맞는 평가지표 (evaluation metrics)를 선택
> 검증 정확도로 해도 되지만 공부를 위한 프로젝트다보니 다양하게 시도할 예정
### 베이스라인을 선택
## 주의점
### 정보의 누수(leakage) 확인
```python
mport graphviz
from sklearn.tree import export_graphviz
tree = pipe.named_steps['decisiontreeclassifier']
dot_data = export_graphviz(
tree,
feature_names=X_train.columns,
class_names=y_train.unique().astype(str),
filled=True,
proportion=True
)
graphviz.Source(dot_data)
```

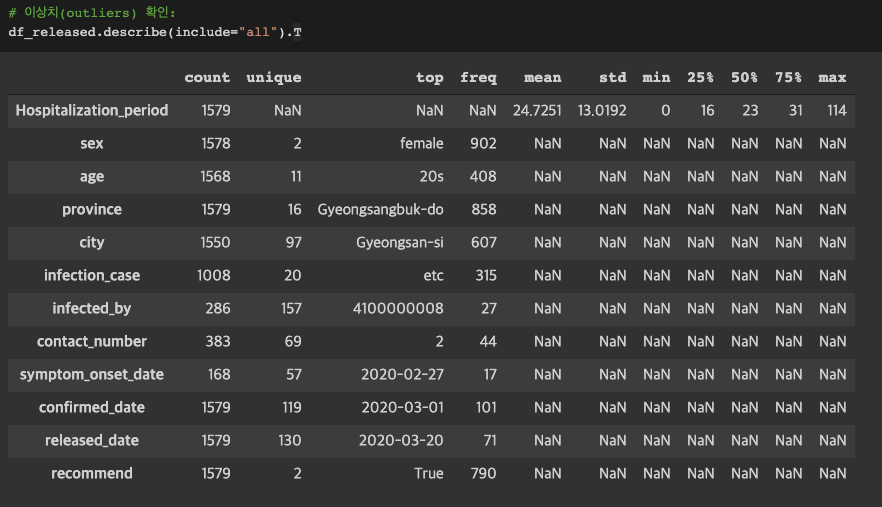
### 이상치(outliers) 처리
----------------
----------------
----------------
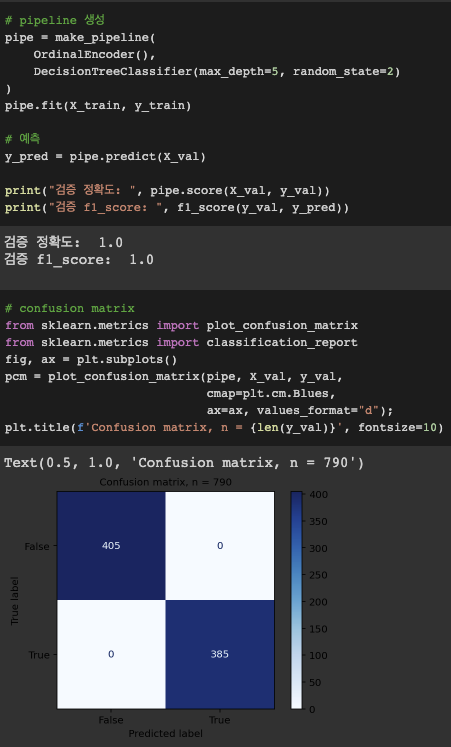
모델링도중 충격과 공포인 상태로 리허설 진행
+) 여담
> 덕분에 다양한 시각화, 데이터셋을 만들다 흥미로운 그래프를 만들게 되었습니다.
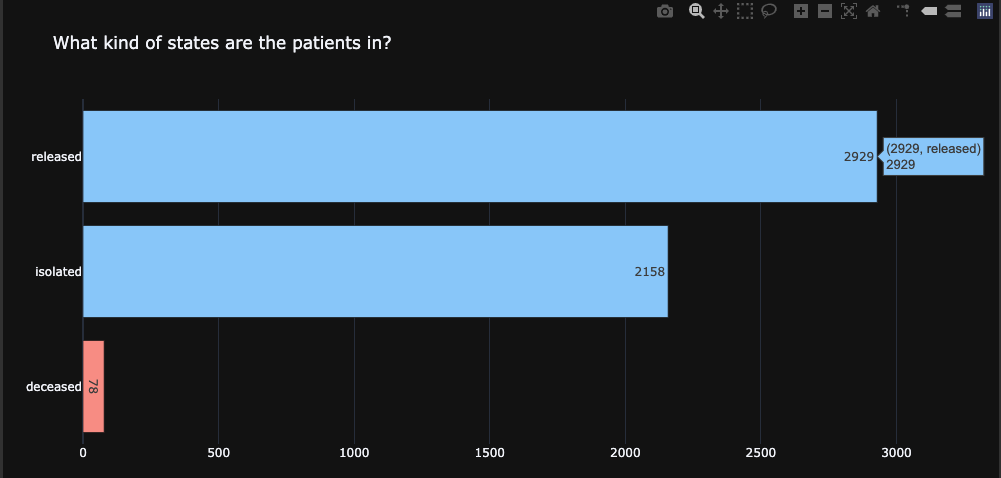
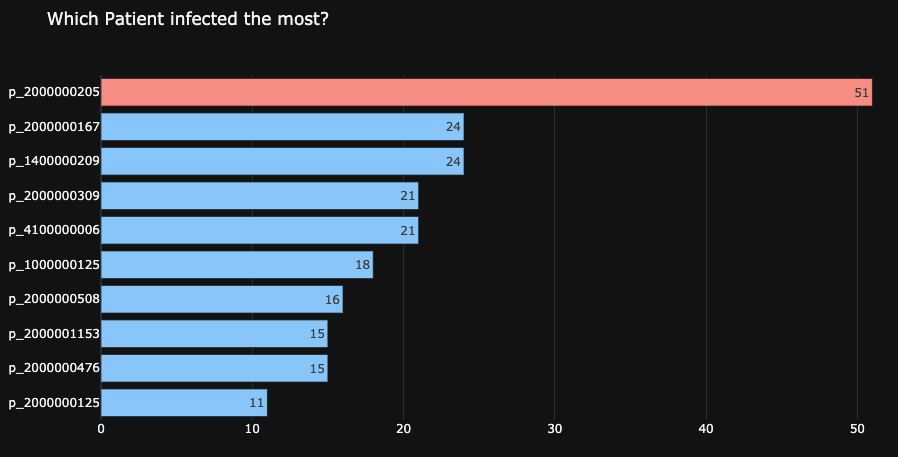
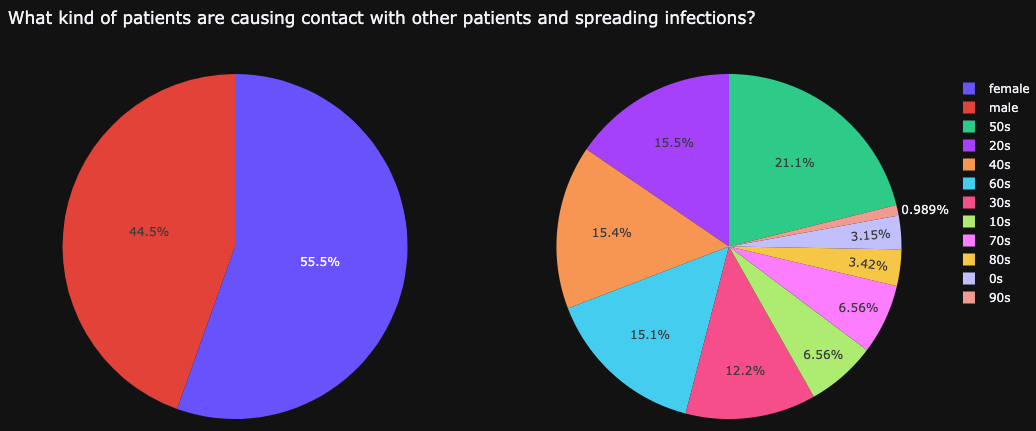
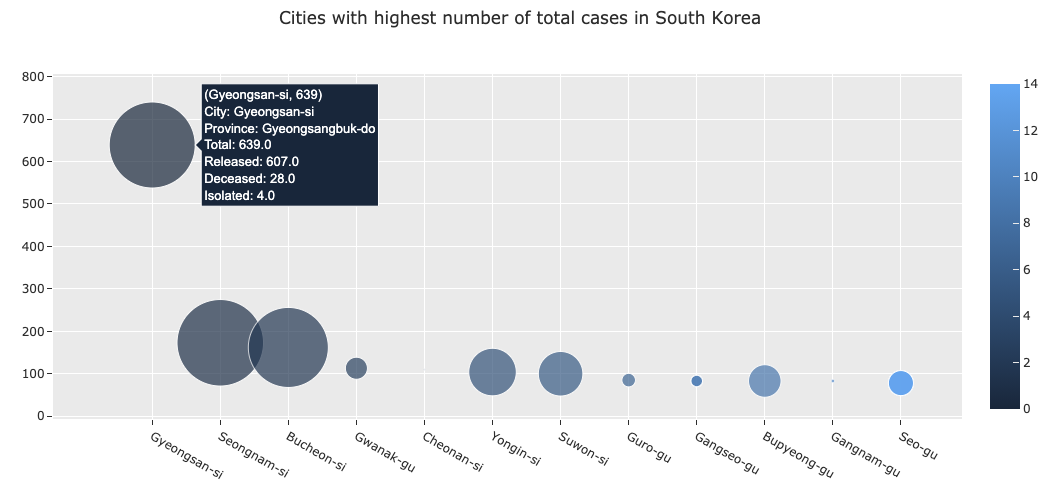
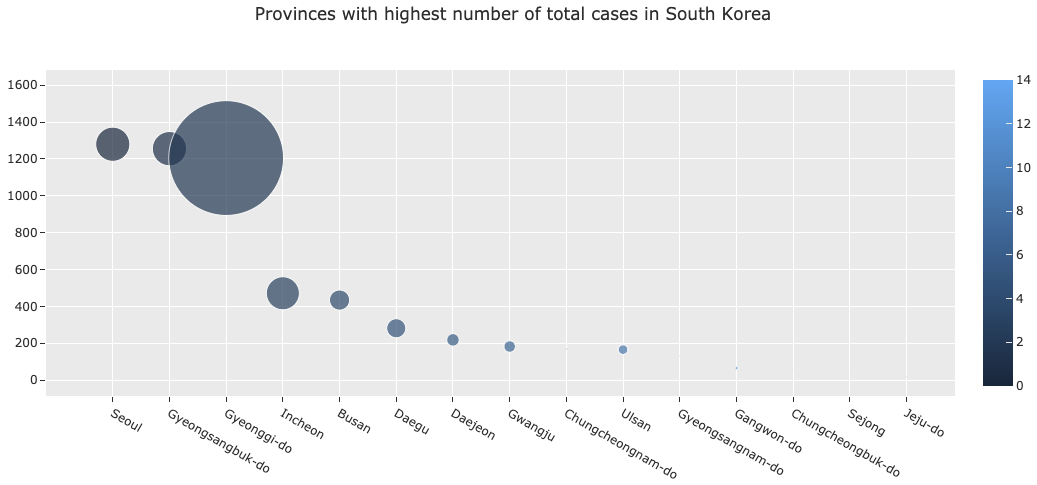
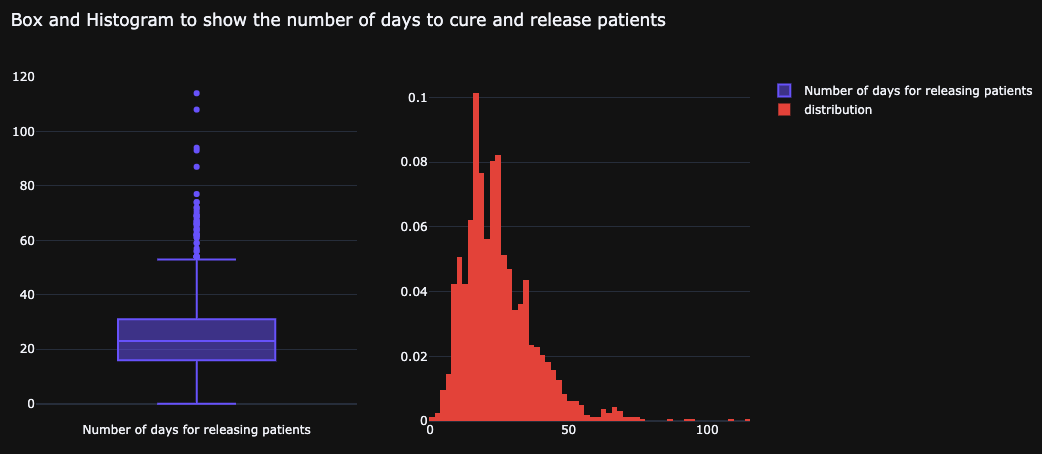
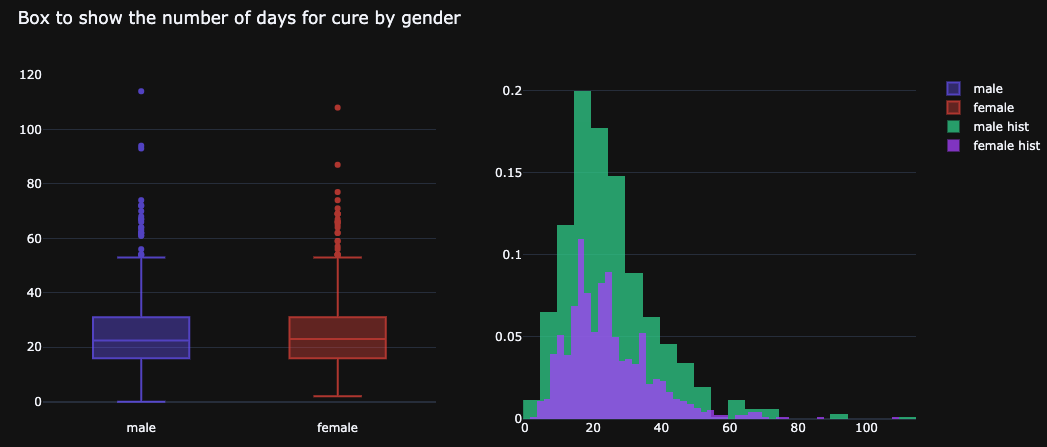
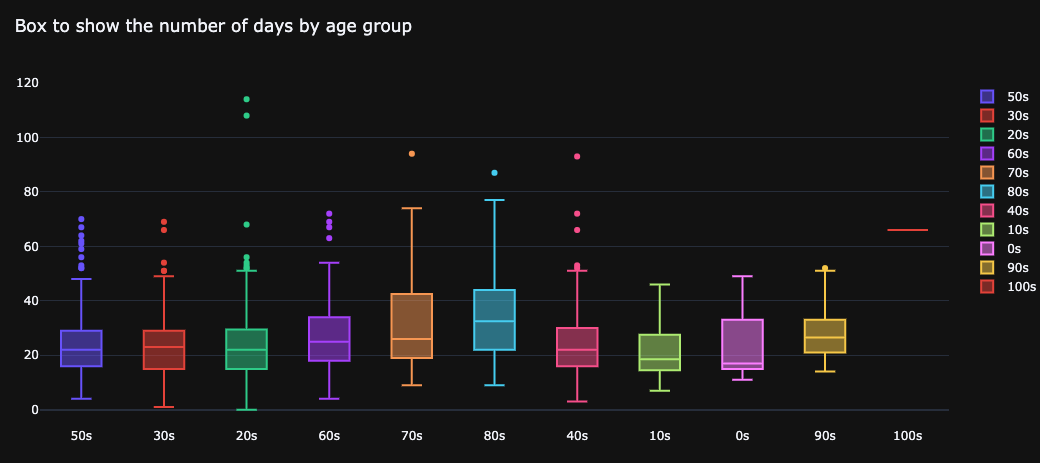
> 흥미로웠던 시각화
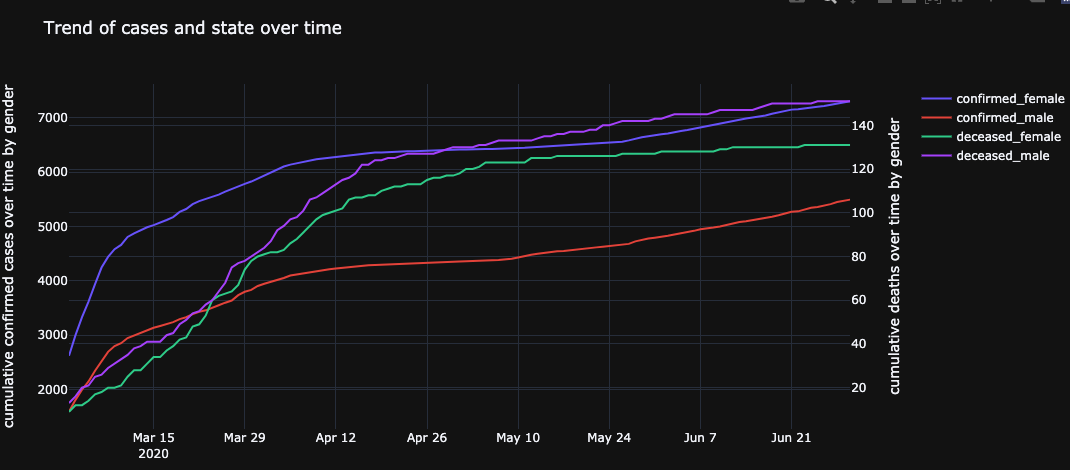
- 남성 환자보다 여성 환자의 확진 건수가 높지만 여성 환자의 사망률에 비해 남성 환자의 사망률이 높다.
~해당 내용에 대해 도전하려했으나, 시간이 부족하여 우선 간단한 내용으로 문제 정의 변경함~
Contributor guide
No contributing guide indexed for this repository
Research direction
The issue names no repository files or tests. Start with the problem definition and the linked DS4C dataset, then inspect the PatientInfo fields and the sklearn pipeline using DecisionTreeClassifier; done means the stated binary classification model is defined and its evaluation is documented.
Written by the indexing model from the issue text.
Assessment
- Tech stack
- python, scikit-learn
- Domain
- data, machine-learning
- Issue type
- Feature
- Difficulty
- 5/5
- Estimated time
- Over a week
- Activity status
- Stale
- Clarity
- Needs clarification
- Newbie friendliness
- 20/100