codestates / codestates/ds-blog
[윤현태] 와인 성분 데이터 분석하기
- Dominant language
- No language data
- Stars
- 2
- Forks
- 4
- PR merge metrics
- No merged PRs in 30d
Description
어떤 와인이 맛있을까?
사실 맛에 대한 평가는 사람들마다 굉장히 주관적이다. 그 중에서도 사람들이 전문적으로 평가를 내리는 것이 와인인데, 맛에 대한 평가표조차 하나가 아니라 여러가지일 정도로 사람들이 와인을 평가하는 것을 굉장히 중요하게 여긴다. 그러면 단순히 풍미나 맛이 아닌, 성분으로 분석을 하게 되면 데이터가 어느정도 와인의 맛을 평가할 수 있을까? 지금부터 한번 알아보자.
##1. 데이터 확인하기
```py
import pandas as pd
df=pd.read_csv("winequality-red.csv")
df.info()
```
```py
RangeIndex: 1599 entries, 0 to 1598
Data columns (total 12 columns):
# Column Non-Null Count Dtype
--- ------ -------------- -----
0 fixed acidity 1599 non-null float64
1 volatile acidity 1599 non-null float64
2 citric acid 1599 non-null float64
3 residual sugar 1599 non-null float64
4 chlorides 1599 non-null float64
5 free sulfur dioxide 1599 non-null float64
6 total sulfur dioxide 1599 non-null float64
7 density 1599 non-null float64
8 pH 1599 non-null float64
9 sulphates 1599 non-null float64
10 alcohol 1599 non-null float64
11 quality 1599 non-null int64
dtypes: float64(11), int64(1)
memory usage: 150.0 KB
```
0: 주석산 농도
1: 아세트산 농도
2: 구연산 농도
3: 잔류 당분 농도
4: 염화 나트륨 농도
5: 유리 아황산 농도
6: 총 아황산 농도
7: 밀도
8: pH 농도
9: 황산칼륨 농도
10: 알코올 도수
11: 와인 등급(0~10)
11번은 target, 나머지는 feature들이 된다.
##2. data 나누기
sklearn의 train_test_split을 사용해서 데이터를 train,test data로 나눠준다.
```py
from sklearn.model_selection import train_test_split
train,test =train_test_split(df,random_state=2)
train.shape,test.shape
X_train=train.drop(columns='quality')
y_train=train['quality']
X_test=test.drop(columns='quality')
y_test=test['quality']
```
##3.feature 수 정하기
SelectKBest는 사용자가 K값을 정하면 특정 평가 방법을 통해서 K개의 feature들의 조합중 어떤 조합이 가장 높은 점수를 얻었는지를 계산해준다. 이것을 이용하면 몇개의 feature을 사용해야 하는지, 또 어떤 feature들을 사용해야 하는지 알 수 있다.
```py
from sklearn.linear_model import LinearRegression
import matplotlib.pyplot as plt
from sklearn.feature_selection import f_regression, SelectKBest
training = []
testing = []
ks = range(1, len(X_train.columns)+1)
# 1 부터 특성 수 만큼 사용한 모델을 만들어서 MAE 값을 비교한다.
for k in range(1, len(X_train.columns)+ 1):
selector = SelectKBest(score_func=f_regression, k=k)
X_train_selected = selector.fit_transform(X_train, y_train)
X_test_selected = selector.transform(X_test)
#어떤 column들을 선택했는지 마스킹한다.
all_names = X_train.columns
selected_mask = selector.get_support()
selected_names = all_names[selected_mask]
print(f'K={k}:',selected_names)
model = LinearRegression()
model.fit(X_train_selected, y_train)
y_pred = model.predict(X_train_selected)
mae = mean_absolute_error(y_train, y_pred)
training.append(mae)
y_pred = model.predict(X_test_selected)
mae = mean_absolute_error(y_test, y_pred)
r2 = r2_score(y_test, y_pred)
testing.append(mae)
print(r2)
plt.plot(ks, training, label='Training Score', color='b')
plt.plot(ks, testing, label='Testing Score', color='g')
plt.ylabel("MAE (quality)")
plt.xlabel("Number of Features")
plt.title('Validation Curve')
plt.legend()
plt.show()
```
```py
K=1: Index(['alcohol'], dtype='object')
0.1689944396347307
K=2: Index(['volatile acidity', 'alcohol'], dtype='object')
0.24984364535835302
K=3: Index(['volatile acidity', 'sulphates', 'alcohol'], dtype='object')
0.2701727683549324
K=4: Index(['volatile acidity', 'citric acid', 'sulphates', 'alcohol'], dtype='object')
0.2707454838676665
K=5: Index(['volatile acidity', 'citric acid', 'density', 'sulphates', 'alcohol'], dtype='object')
0.2690372467408283
K=6: Index(['volatile acidity', 'citric acid', 'total sulfur dioxide', 'density',
'sulphates', 'alcohol'],
dtype='object')
0.2839876428687995
K=7: Index(['volatile acidity', 'citric acid', 'chlorides', 'total sulfur dioxide',
'density', 'sulphates', 'alcohol'],
dtype='object')
0.29593812503548633
K=8: Index(['fixed acidity', 'volatile acidity', 'citric acid', 'chlorides',
'total sulfur dioxide', 'density', 'sulphates', 'alcohol'],
dtype='object')
0.30402673458856977
K=9: Index(['fixed acidity', 'volatile acidity', 'citric acid', 'chlorides',
'total sulfur dioxide', 'density', 'pH', 'sulphates', 'alcohol'],
dtype='object')
0.30870309858801304
K=10: Index(['fixed acidity', 'volatile acidity', 'citric acid', 'chlorides',
'free sulfur dioxide', 'total sulfur dioxide', 'density', 'pH',
'sulphates', 'alcohol'],
dtype='object')
0.3132480810592956
```
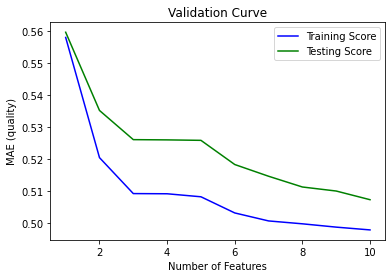
K=10, 즉 전부다 선택했을 때 R-square 값이 가장 좋았고, mae 값도 이 때가 가장 좋다고 나온다.
##4. LinearRegression 해보기
```py
from sklearn.linear_model import LinearRegression
from sklearn.preprocessing import StandardScaler
from sklearn.metrics import mean_absolute_error, r2_score
model_lin = LinearRegression()
scaler=StandardScaler()
X_train_scaled=scaler.fit_transform(X_train)
X_test_scaled=scaler.fit_transform(X_test)
model_lin.fit(X_train_scaled,y_train)
y_pred=model_lin.predict(X_test_scaled)
mae = mean_absolute_error(y_test, y_pred)
r2 = r2_score(y_test, y_pred)
print(f'test MAE: {mae:,.0f}')
print(f'test R2: {r2} \n')
```
```py
test MAE: 1
test R2: 0.30183091797344774
```
##5. coefficients값 해석하기.
```py
coefficients = pd.Series(model_lin.coef_, X_train.columns)
coefficients.sort_values().plot.barh();
```
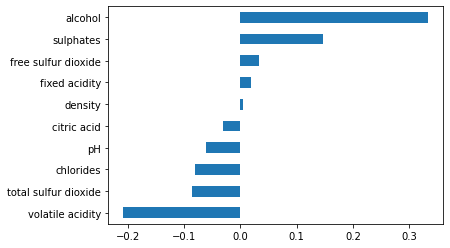
coefficients값이 양수이면 그 feature들의 값이 양수일 때 quality 또한 증가한다는 것을 의미하며, 반대로 feature들의 값이 음수일 때 quality가 감소한다는 뜻이다.
quality가 증가하는 항목: alcohol, sulphates(황산칼륨), free sulfur dioxide(유리 아황산), fixed acidity(주석산), density(밀도)
알코올: 단맛과 산성의 균형을 유지하도록 돕는다.
황산칼륨: 와인의 향을 보존시킨다.
아황산: 이스트 발효의 부산물. 항산화제로 산화 방지, 살균작용, 갈변 방지등을 한다.
주석산: 실제로 와인의 품질과 맛에 상당한 영향을 끼친다.
밀도: 물의 비중은 1g/cc 인 반면 알코올의 비중은 0.79g/cc 이기 때문에, 알코올 말고 다른 성분들이 얼마나 들어있는지에 따라 quality에 영향을 미친다.
quality가 감소하는 항목: citric acid(구연산), pH, chlorides(염화나트륨), total sulfur dioxide(총 아황산), volatile acidity(아세트산)
구연산: 구연산은 와인의 산도를 높이기 위해 발효 과정 동안 산성 보충제로 가장 흔하게 사용된다. 산도가 낮다면 미각에서 더 부드럽고 둥글둥글하게 느껴지는데, 이부분이 높아진다면 조금 딱딱하게 느낄 수 있다.
염화나트륨: 소금을 생각하면 된다. 고농도를 갖게되면 포도주에 강한 짠맛을 준다.
총 아황산: 이 성분이 많게 되면 포도주와 와인의 자연적인 향기를 막아주기 때문에 없으면 없을 수록 더 많은 향기를 맡을 수 있게 된다.
아세트산: 많으면 매니큐어 제거제처럼 날카로운 냄새를 맡을 수 있다. 그러나 낮은 수준에서는 과일 향이 나는 산딸기, 정열적인 과일 또는 체리 같은 맛을 첨가할 수 있다. 그래서 적으면 적을수록 좋다.
#결론
음식도 과학이라는 말이 와인을 보면서 생각났다. 물론 실제로 어떻게 배합하느냐에 따라 다르겠지만, 결국 맛은 어떤 성분이냐에 따라서 크게 좌우된다는 것을 알 수 있었다.
Contributor guide
No contributing guide indexed for this repository
Research direction
The issue body contains a Korean wine-quality analysis using pandas, scikit-learn, and matplotlib, but it names no destination file, entry point, or requested change. Confirm where this article should be added and what review or formatting criteria define done before starting.
Written by the indexing model from the issue text.
Assessment
- Tech stack
- matplotlib, pandas, python
- Domain
- content, data, documentation, machine-learning
- Issue type
- Documentation
- Difficulty
- 3/5
- Estimated time
- 1-2 days
- Activity status
- Stale
- Clarity
- Needs clarification
- Newbie friendliness
- 25/100