cockroachdb / cockroachdb/cockroach
sql: Tool tip update: statement contention metric only shows traced queries
Open
A-sql-observability
C-bug
T-observability
- Dominant language
- Go
- Stars
- 32.5k
- Forks
- 4.1k
- PR merge metrics
- PR metrics pending
Description
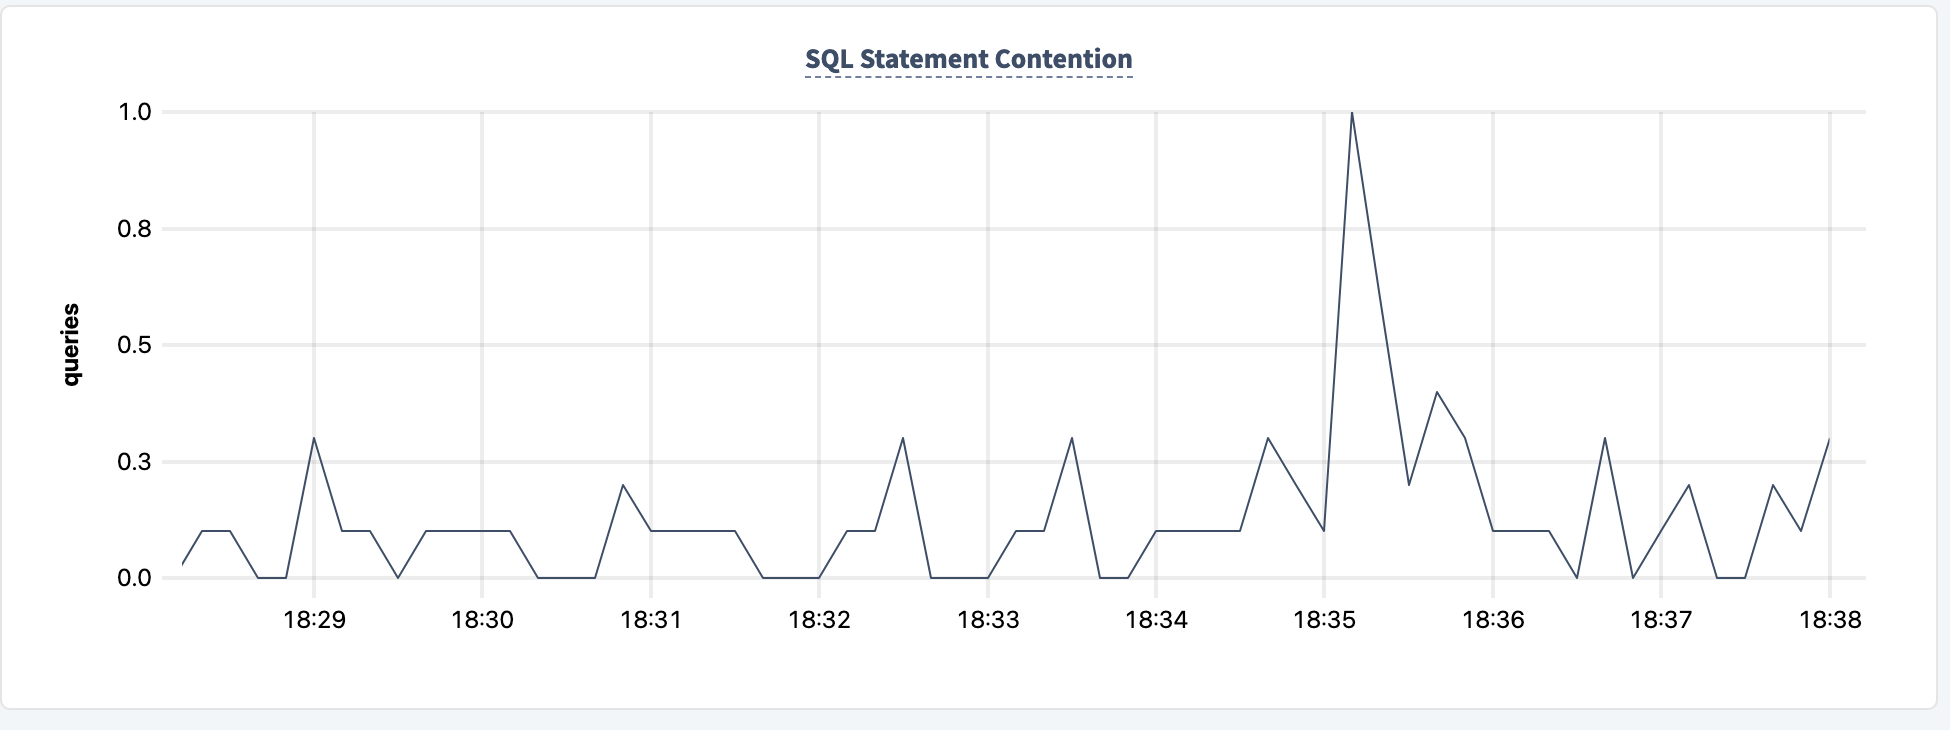
The Metrics page in the console has a prominent SQL Statement Contention metric, described as "A moving average of the number of SQL statements executed per second that experienced contention across all nodes.".
The metric is based off tracing. Tracing is only enabled on a very small percentage of queries currently. The number being display is significantly less than the actual number of contention events that occur.
Jira issue: CRDB-24131
Epic CRDB-32130
Contributor guide
Assessment
This issue has not been assessed yet.