Display each component of signals/multiplet in GSD peak picking
- Dominant language
- TypeScript
- Stars
- 80
- Forks
- 34
- Avg merge
- 2d 9h
- Merged PRs (30d)
- 36
Description
Since the peak picking is using GSD, and because it is a similar to a deconvolution method, it would be nice to show how multiplets/signals are decomposed. (see blue lines in the picture)
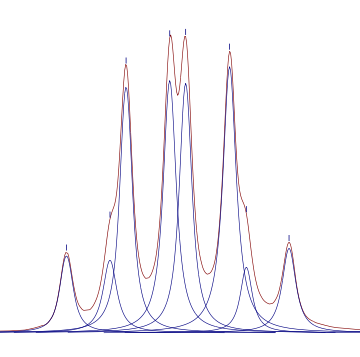
One could also display the sum of all peaks - maybe as a dashed line so that we can see it even when the match to experimental is very good. An option could be to show the rest of subtracting the sum and the experimental.
Besides, I think one can select what shape is assumed (gaussian, lorentzian, Vogt/? ) when calling the peak-picking. But this is not left to the user (default?)
When plotting the results, we should inform the user on this choice (allow him to change?)
The width(s) of the peaks could also be displayed in the peak list pannel (maybe optionnally). In the case of Vogt, show the two parameters of (maybe) the sum of lor+gau expressed as widht at half height.
Contributor guide
No contributing guide indexed for this repository
Assessment
This issue has not been assessed yet.