Line chart - combination of fill `start` and `end`
- Dominant language
- JavaScript
- Stars
- 67.7k
- Forks
- 11.9k
- Avg merge
- 7h 39m
- Merged PRs (30d)
- 5
Description
### Feature Proposal
Hello all,
I'm working an a react-app displaying a pretty complex line chart.
Is there a possibility to combine both `fill:start` and `fill:end` properties, for the data point area to be filled above and under the data point entry?
My current dataset config looks like this:
```
export const initialUnderMinimum: ChartDataset<'line'> = {
label: 'UNDER_MIN_VALUE',
data: [],
showLine: true,
fill: 'start',
}
```
The chart gets rendered in a following manner:
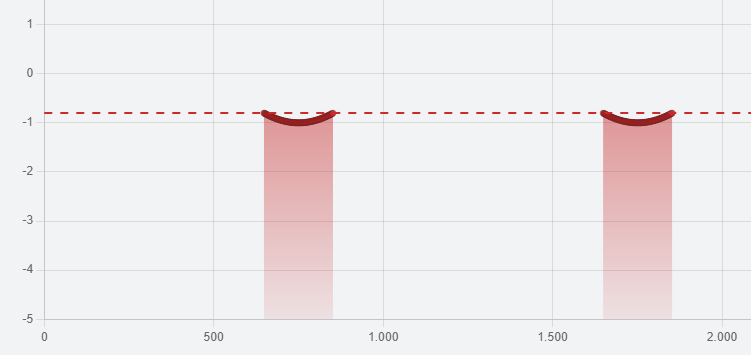
The data gets filled dynamically after the application start based upon a reoccuring GET-request.
The only way to achieve what i want, is to create the copy of the dataset with fill: 'end' and fill it with data the same as i did with the first dataset.
That is, however, not very efficient if the data has like 5000 entries.
Basically i want to achieve something like this:

`chart.js`-Version is 4.2.1, `react-chartjs-2` version is 5.2.0.
Feel free to close the issue, if that's the case for the other ( `react-chartjs-2`) package.
### Possible Implementation
Implement a feature to be able to pass an array or function as the fill value.
Contributor guide
No contributing guide indexed for this repository
Assessment
This issue has not been assessed yet.