Line graph a little off
- Dominant language
- JavaScript
- Stars
- 67.7k
- Forks
- 11.9k
- Avg merge
- 7h 39m
- Merged PRs (30d)
- 5
Description
### Expected behavior
As the other graphs, when I have a container defined like this
The result is as expected. The graph is in the graph container.
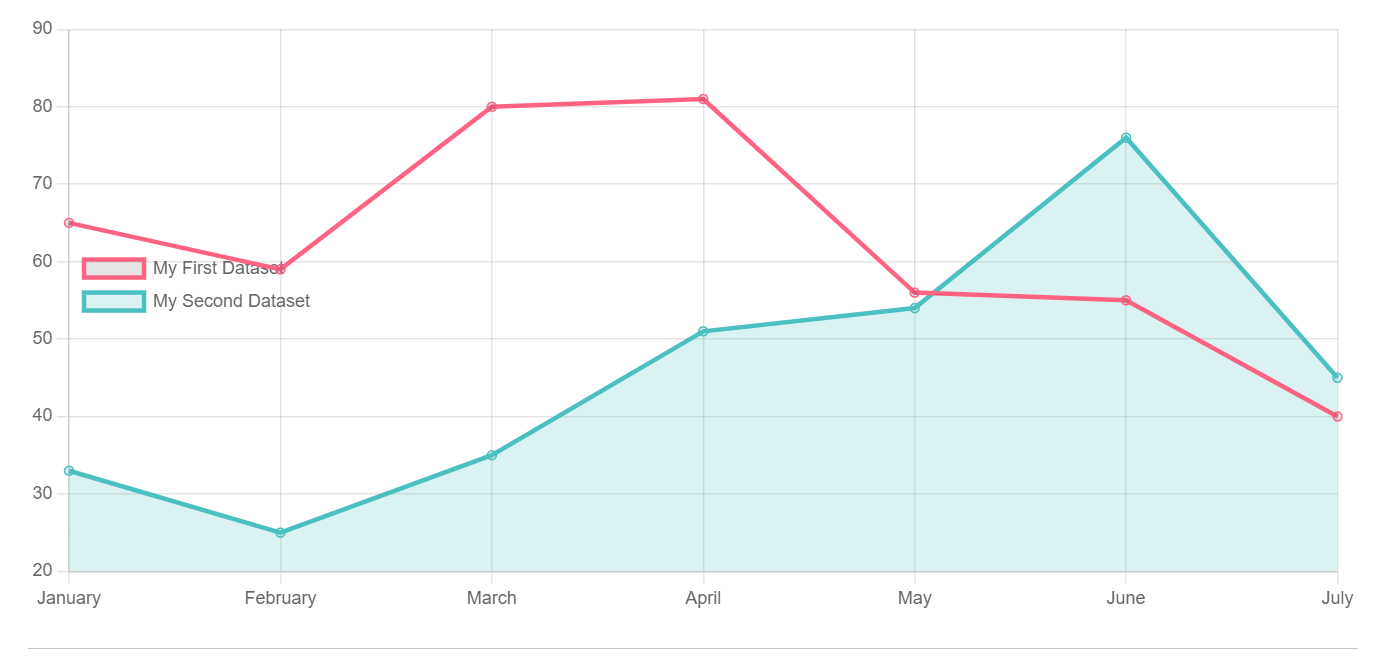
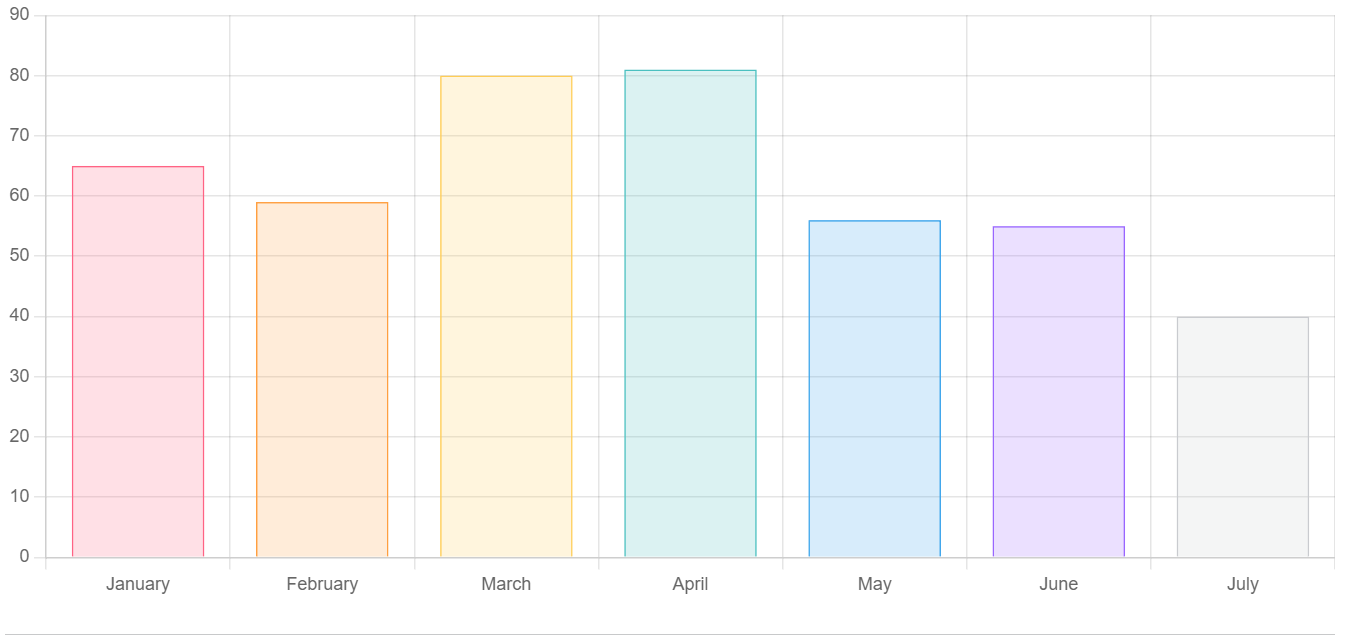
See the horizontal bar at the bottom of the chart.
### Current behavior
With the line graph, the graph is a little off with Microsoft Edge
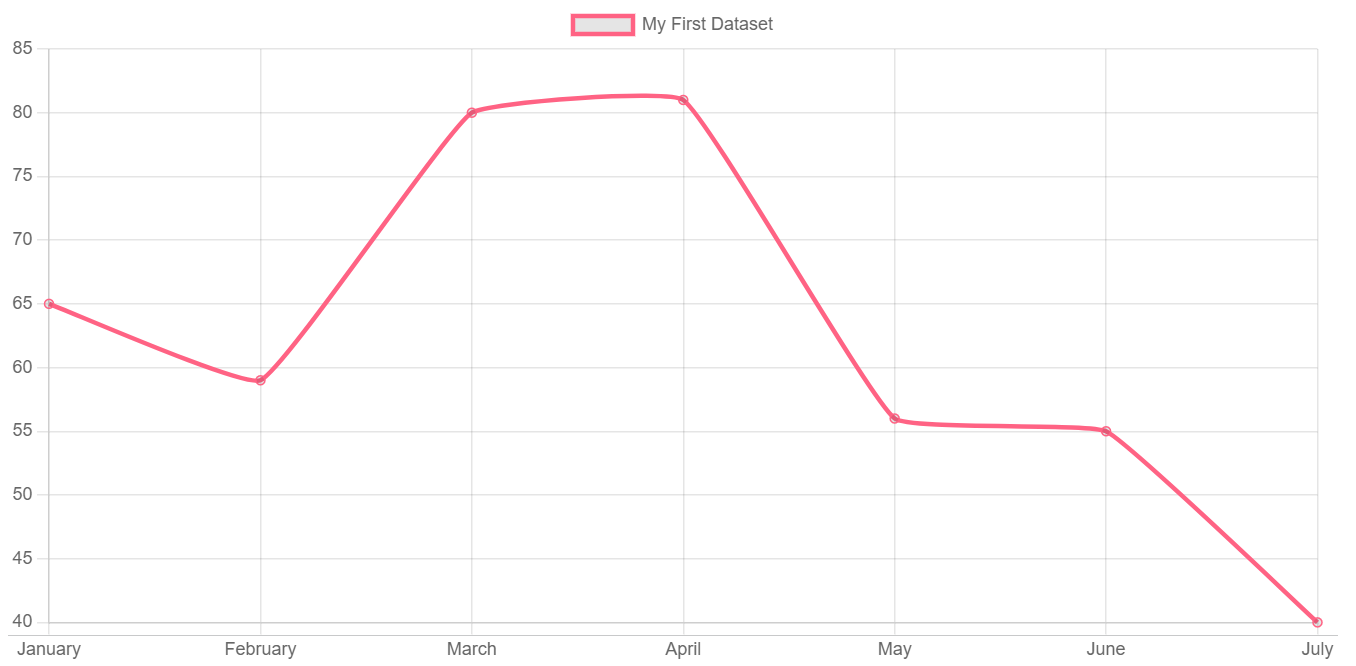
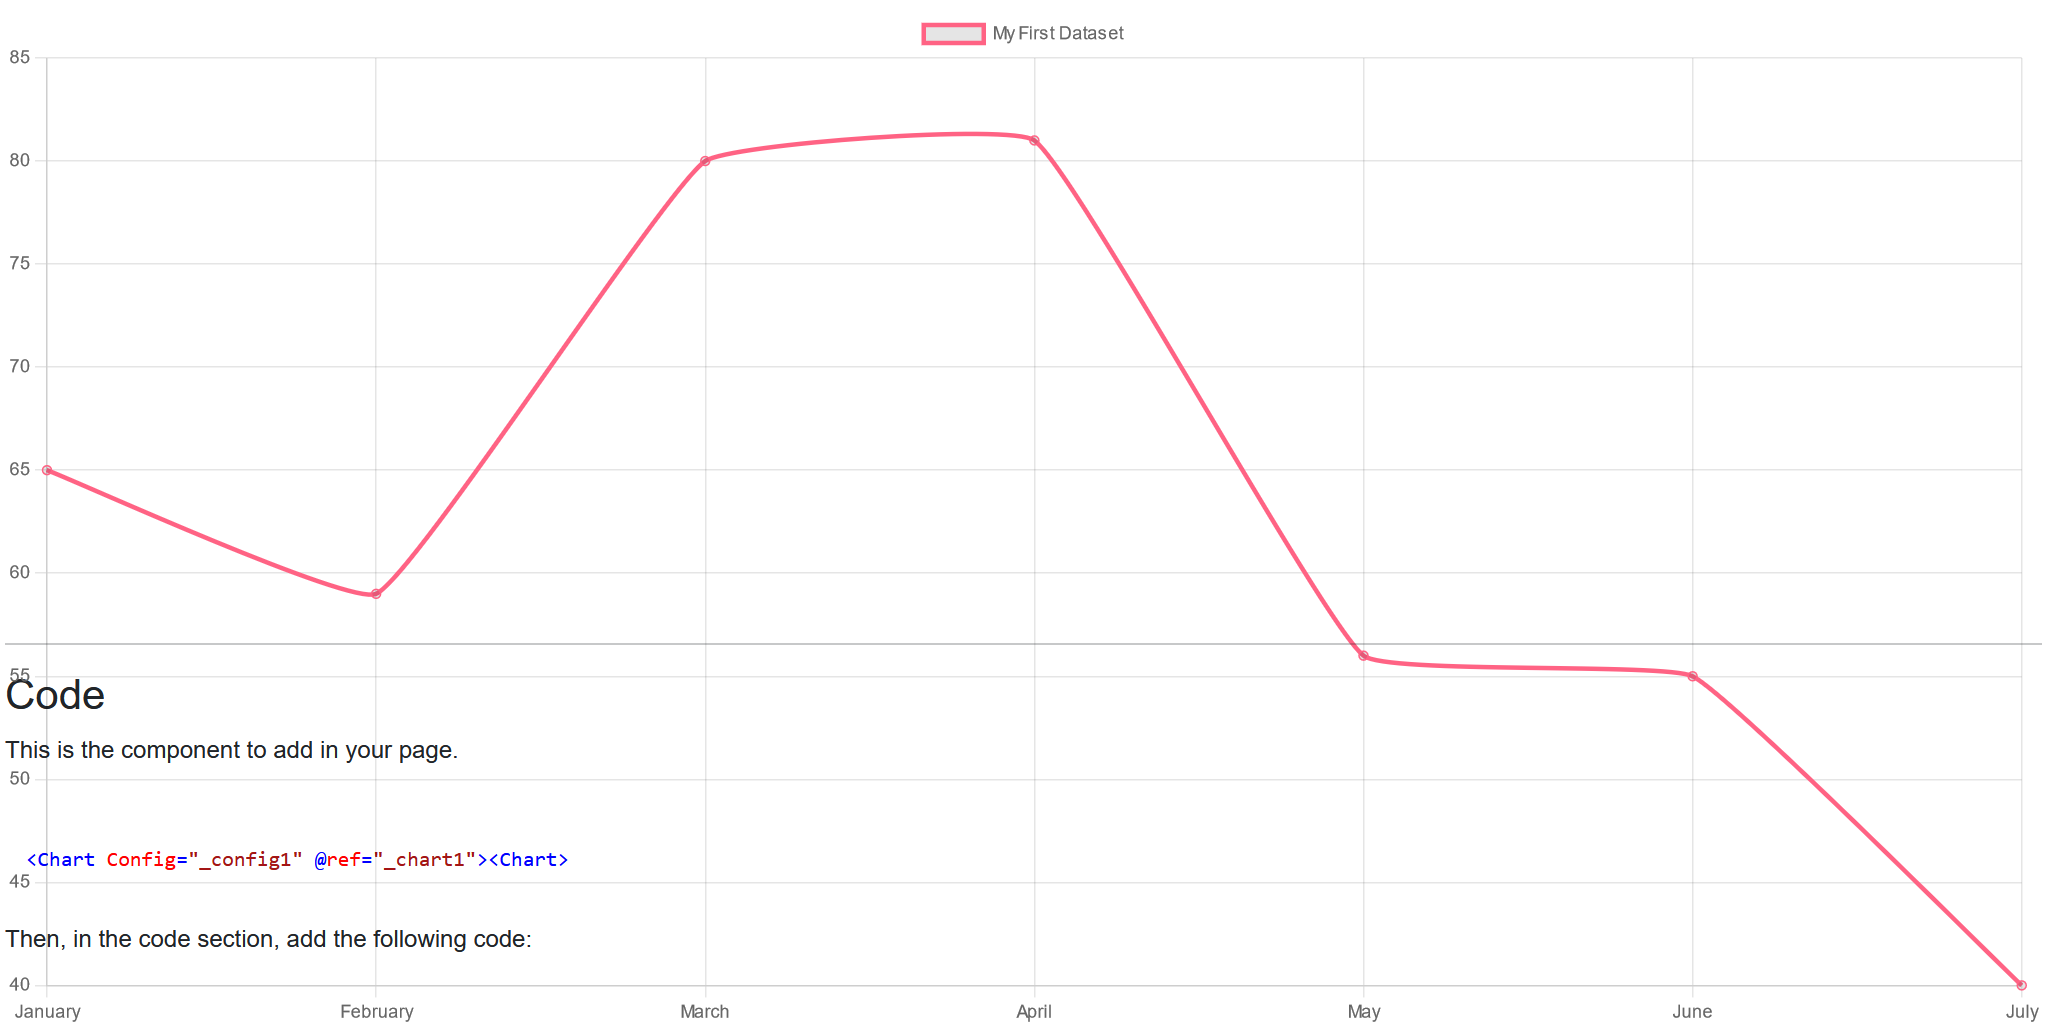
With Firefox is huge
### Reproducible sample
https://codepen.io/erossini/pen/jOxRXLN
### Optional extra steps/info to reproduce
_No response_
### Possible solution
_No response_
### Context
_No response_
### chart.js version
3.7.1
### Browser name and version
Microsoft Edge 106.0.1370.47 (Official build) (64-bit) / Firefox 105.0.3 (64-bit)
### Link to your project
https://github.com/erossini/BlazorChartjs
Contributor guide
No contributing guide indexed for this repository
Assessment
This issue has not been assessed yet.