includeBounds doesn't work for linear axes
Open
type: bug
- Dominant language
- JavaScript
- Stars
- 67.7k
- Forks
- 11.9k
- Avg merge
- 7h 39m
- Merged PRs (30d)
- 5
Description
### Expected behavior
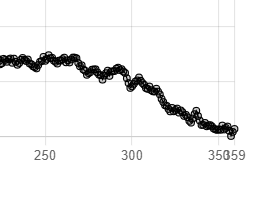
When `scales[scale].ticks.includeBounds` is set to `false`, I expect to not see the last bound tick value.
### Current behavior
The last tick is visible and is overlapping the previous tick.
### Reproducible sample
https://codesandbox.io/s/chart-js-includebounds-doesnt-work-for-linear-axes-vbps8
### Optional extra steps/info to reproduce
_No response_
### Possible solution
_No response_
### Context
_No response_
### chart.js version
v3.7.0
### Browser name and version
Chrome 97
### Link to your project
_No response_
Contributor guide
No contributing guide indexed for this repository
Assessment
This issue has not been assessed yet.