chakra-core / chakra-core/ChakraCore
How to do profiling with ETW
- Dominant language
- JavaScript
- Stars
- 9.3k
- Forks
- 1.2k
- PR merge metrics
- No merged PRs in 30d
Description
I discovered that ChakraCore has supported ETW (https://github.com/Microsoft/ChakraCore/pull/1986
, https://github.com/Microsoft/ChakraCore/issues/328)
I want to leverage this powerful tool for CPU profiling and further analysis, for example, which is the hotspot in JS program/runtime, but I still can't find a way to get useful profile data.
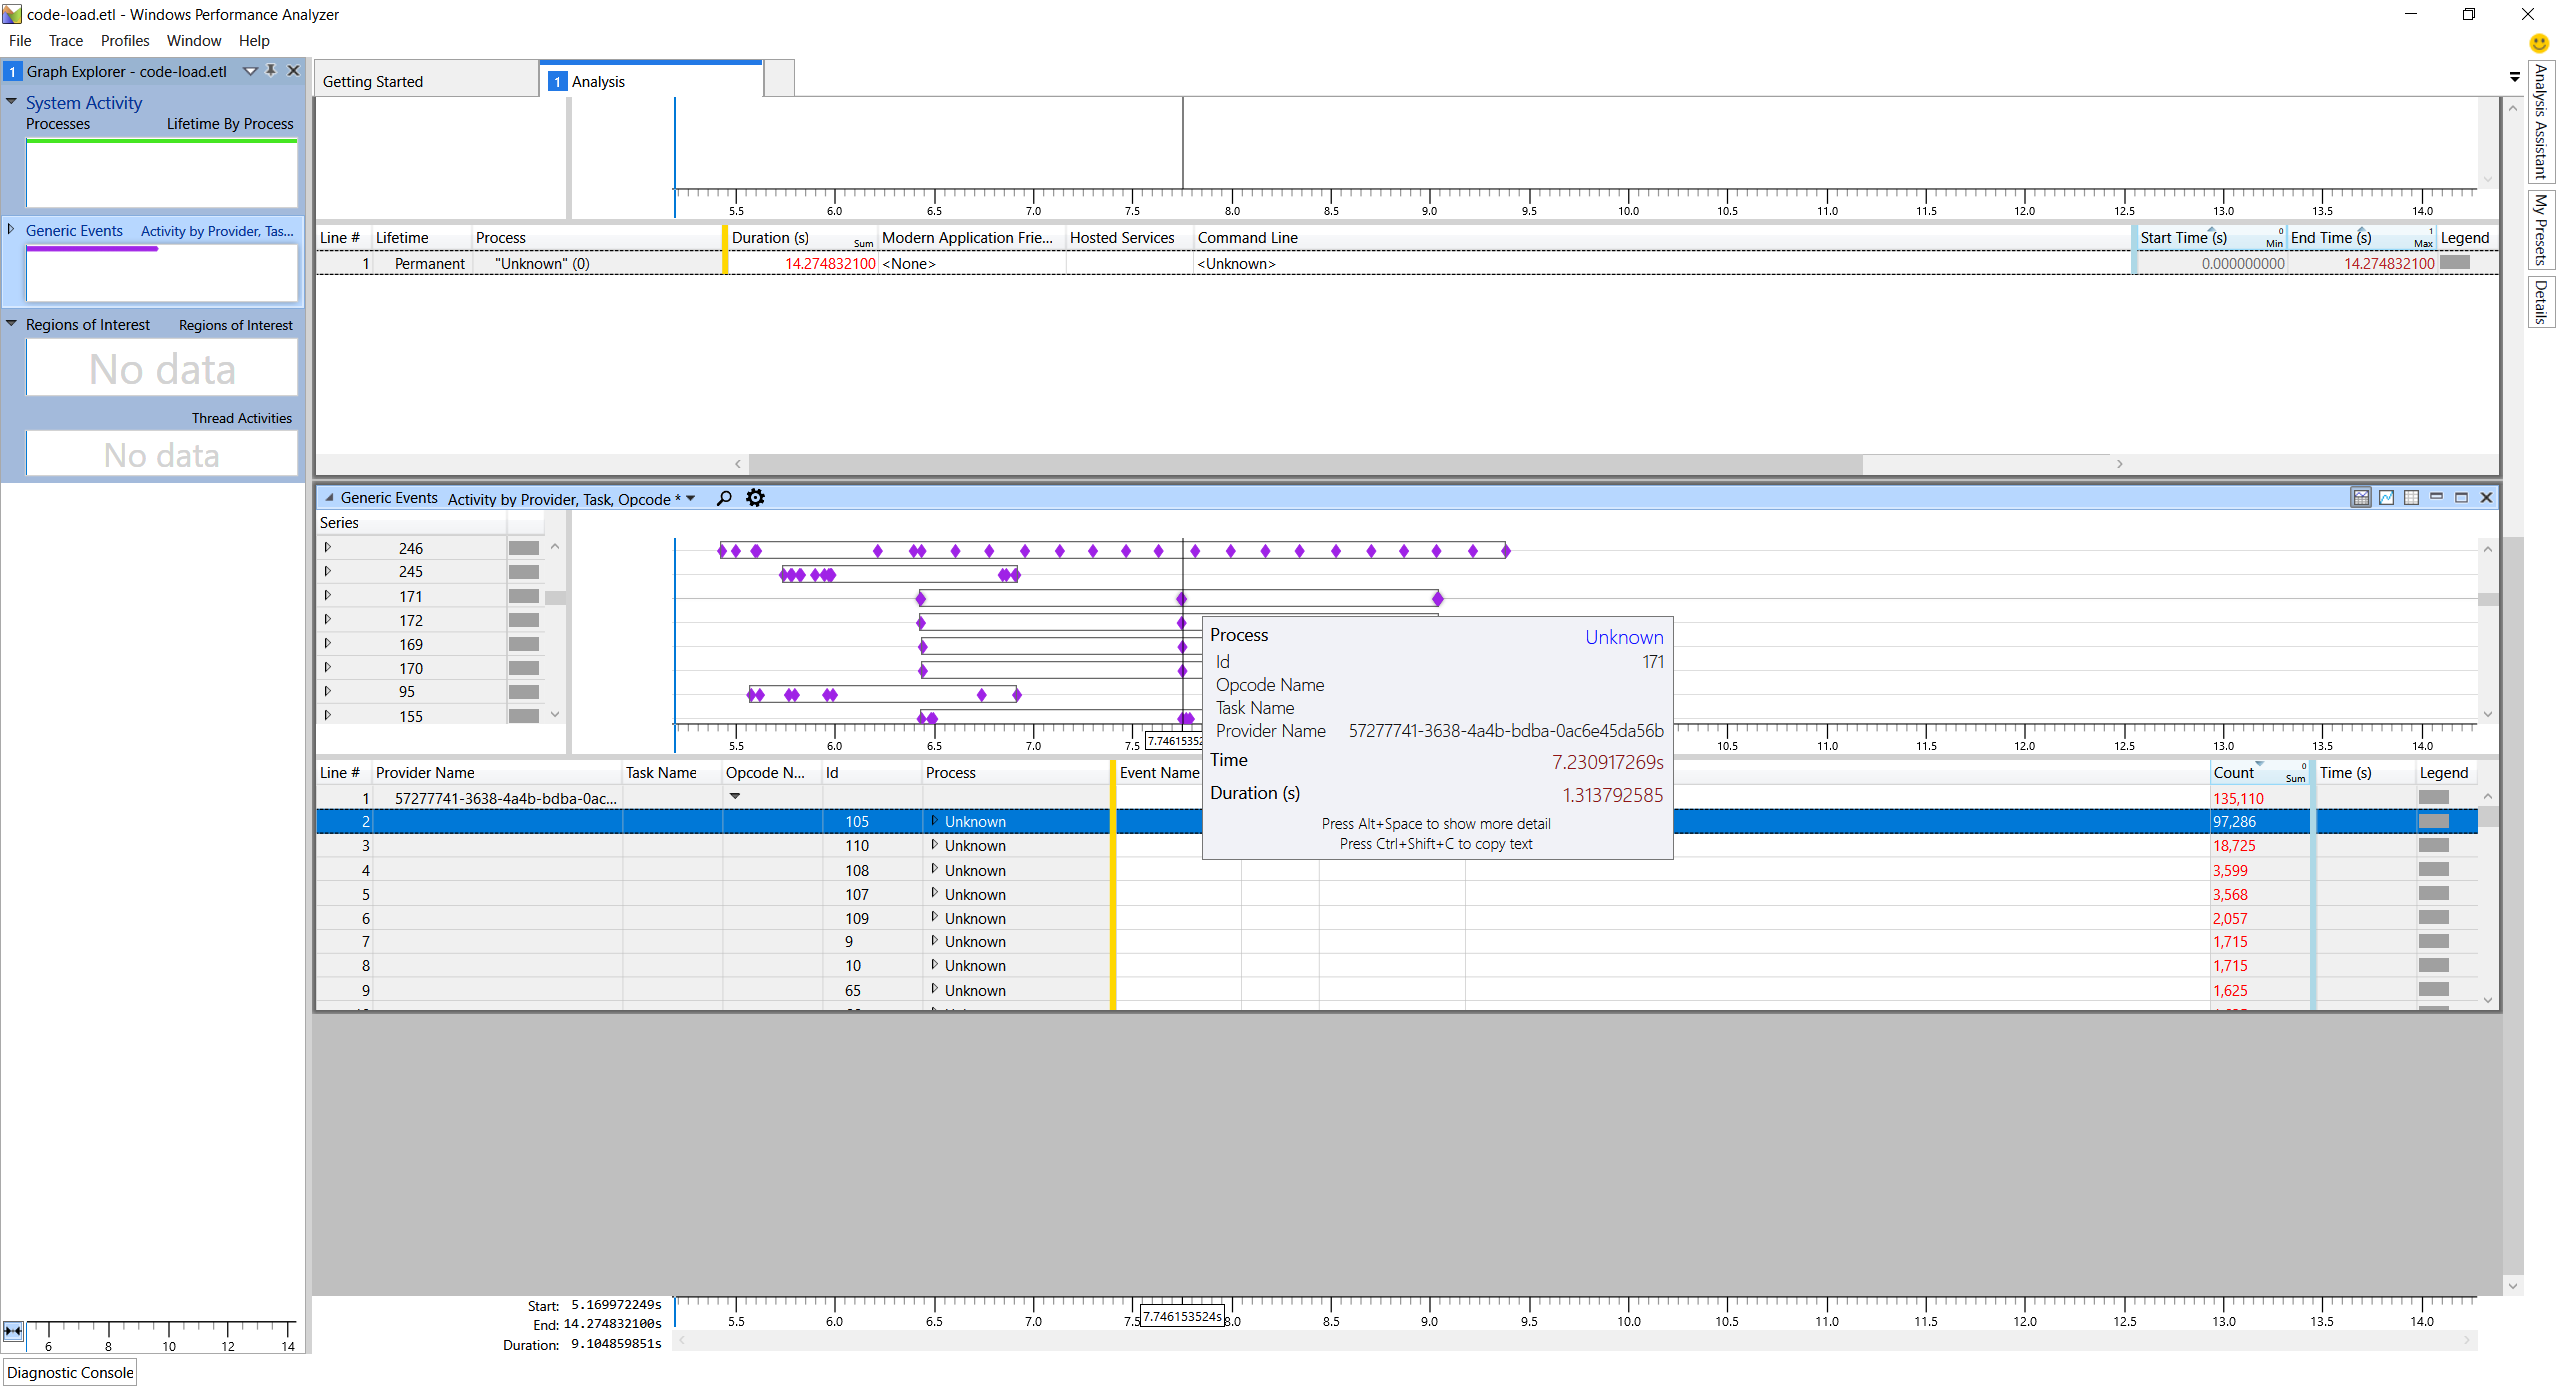
According to the ETW introduction here (https://channel9.msdn.com/Events/Build/2017/P4099), I open MS TraceView, create a new LogSession with a particular GUID "{57277741-3638-4A4B-BDBA-0AC6E45DA56C}" (manifests/Microsoft-Scripting-Chakra-Instrumentation.man), but I see a lot of event activities logging in TraceView even I haven't launch ch.exe, I don't know why but I guess maybe conflict with the ChakraCore in my Edge browser due to they share the same GUID, is it possible?
Therefore, I changed the last digit of GUID from "C" to "B", then TraceView seems able to get some runtime behavior data from the particular ChakraCore during the javascript program execution, but these are all unknown event and process, you can check my attachment for the detail.
Could you tell me how to enable ETW feature in ChakraCore correctly?
Contributor guide
Assessment
This issue has not been assessed yet.