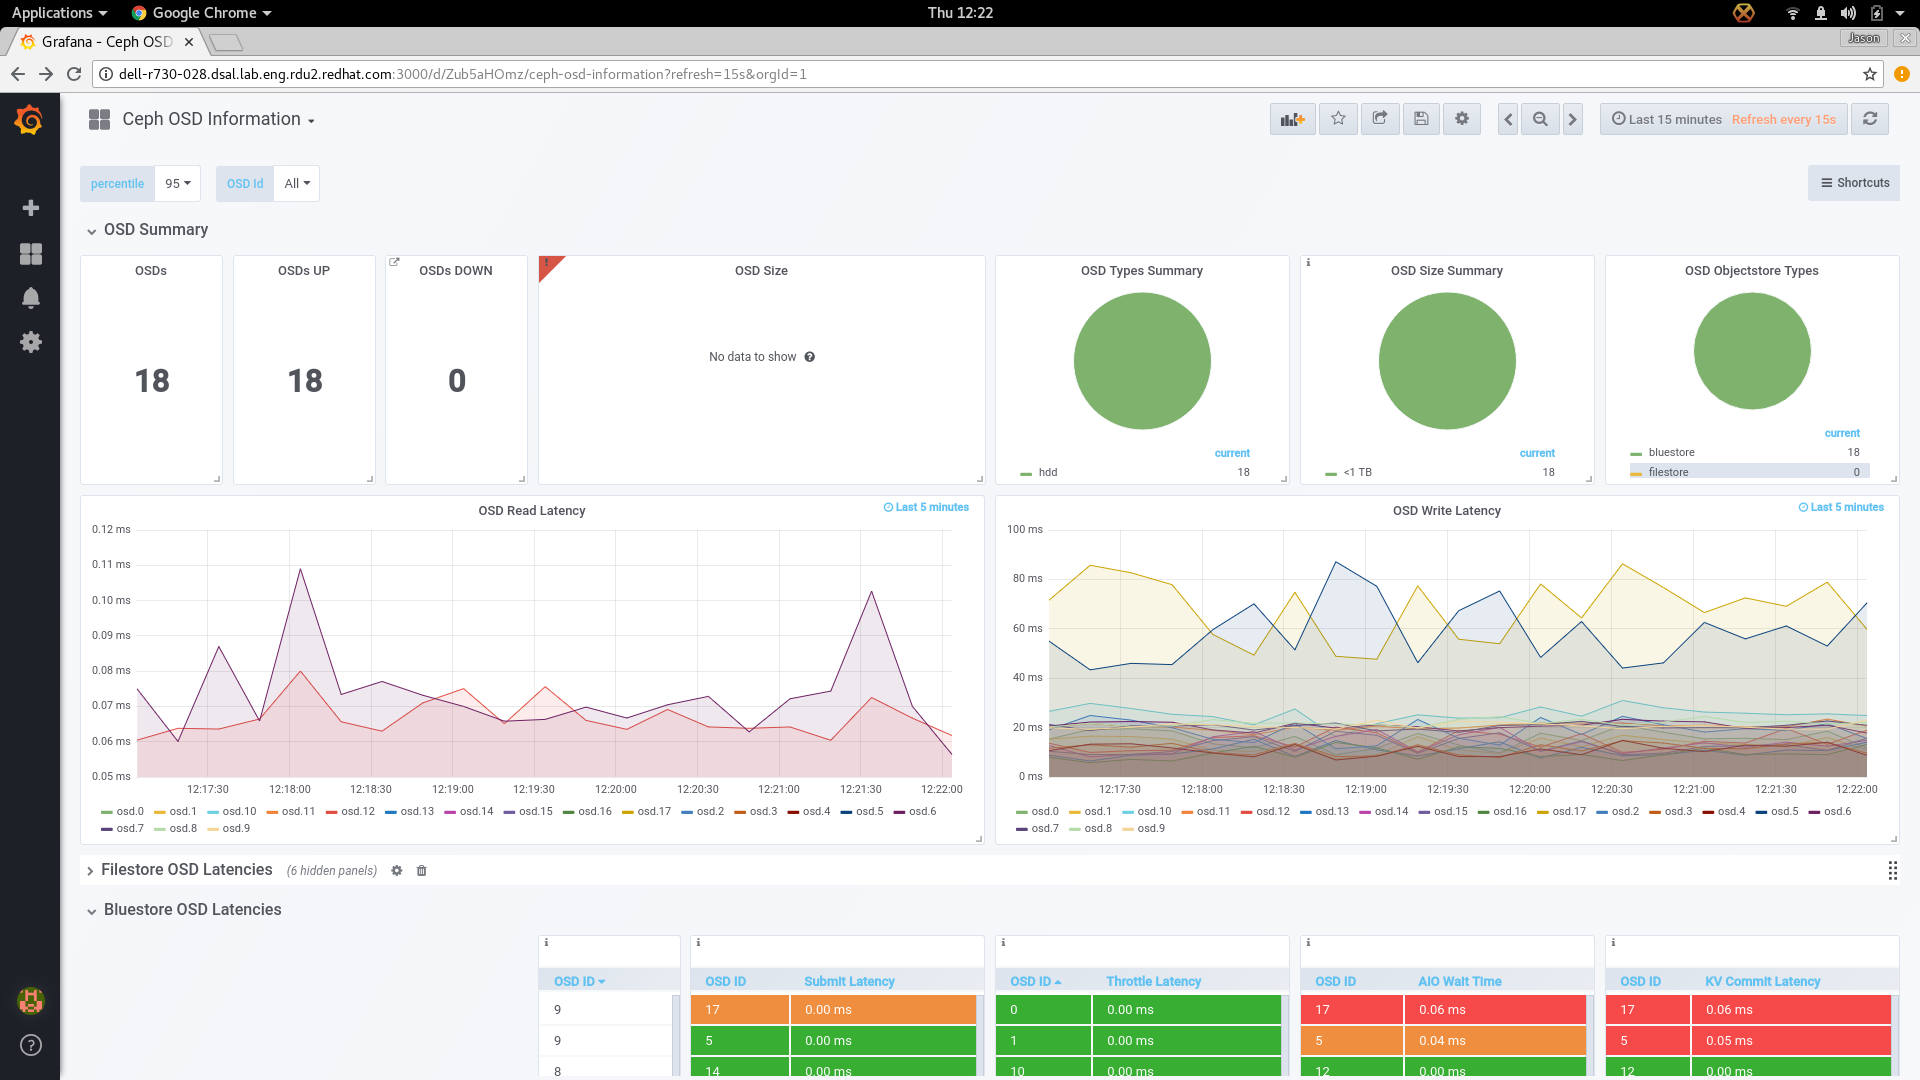
Per-OSD dashboard should include read and write latency
- Dominant language
- Python
- Stars
- 66
- Forks
- 29
- PR merge metrics
- No merged PRs in 30d
Description
Something like the following:
`irate(ceph_osd_op_r_latency_sum[1m]) / on (ceph_daemon) irate(ceph_osd_op_r_latency_count[1m]) * 1000
`
`irate(ceph_osd_op_w_latency_sum[1m]) / on (ceph_daemon) irate(ceph_osd_op_w_latency_count[1m]) * 1000
`
It might also be nice to have a global latency view on the homepage (perhaps merged w/ the apply vs commit latency graph?).
Contributor guide
No contributing guide indexed for this repository
Research direction
Start by locating the dashboard definition and its existing per-OSD panels, then compare the available Ceph read and write latency metrics with the two PromQL expressions in the issue. Done means the per-OSD dashboard shows read and write latency; determine separately whether the optional global homepage view is in scope.
Written by the indexing model from the issue text.
Assessment
- Tech stack
- prometheus
- Domain
- observability
- Issue type
- Feature
- Difficulty
- 3/5
- Estimated time
- 1-2 days
- Activity status
- Stale
- Clarity
- Mostly clear
- Newbie friendliness
- 38/100