Feature: A way to plot area between curves
Open
- Dominant language
- JavaScript
- Stars
- 9.3k
- Forks
- 1.4k
- Avg merge
- 6d 16h
- Merged PRs (30d)
- 1
Description
**Feature request**
I have two splines, one of them is strictly higher than the other, but they might have negative values. I'd like to be able to plot the area between them.
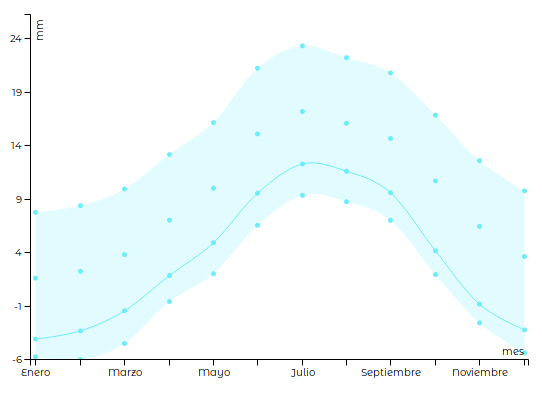
It would look something like that.
Unfortunately in order to produce such effect with the current API I had to do horrible tricks like plotting invisible curves, then computing minimum values and adding an offset to everything just to substract it from from the y-axis labels.
Contributor guide
Assessment
This issue has not been assessed yet.