Rotated Chart and X-axis does not use available space
- Dominant language
- JavaScript
- Stars
- 9.3k
- Forks
- 1.4k
- Avg merge
- 6d 16h
- Merged PRs (30d)
- 1
Description
C3 version: 0.6.12
D3 version: 5.9.1
Browser: Any
OS: Any
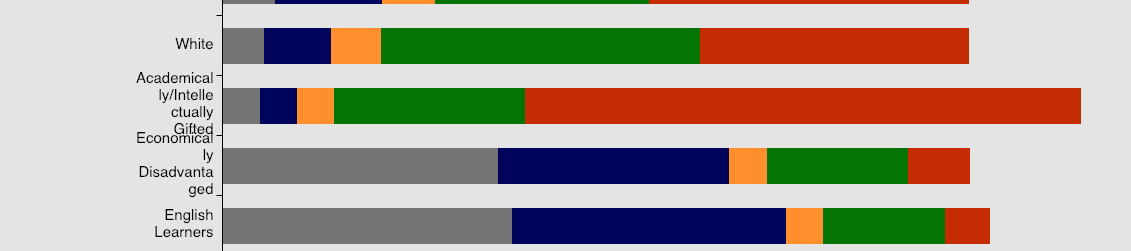
The issue is with very long descriptions for the x-axis tick values. I chose a rotated presentation to avoid wrap. The problem is that even if I give it a left pad, it will not take width. I have tried height with the idea that rotated height becomes width. I have tried x.tick.multiline. I am unable to come up with a solution to have it assign more space to the x category labels when the chart is rotated. Here is the example set of categories.
x: {
rotated: true,
categories: ["ALL","Female","Male","Asian","Black",
"Hispanic","Two or More Races","White",
"Academically/Intellectually Gifted","Economically Disadvantaged",
"English Learners", "Students with Disabilities"],
type: "category"
}
Here is what it looks like:
Contributor guide
Research direction
Start by reproducing the rotated chart with the category list in the issue, focusing on the x-axis tick layout and available space for long labels. The issue is resolved when rotated category labels such as “Academically/Intellectually Gifted” and “Students with Disabilities” receive the intended space without wrapping or clipping.
Written by the indexing model from the issue text.
Assessment
- Tech stack
- d3js, javascript
- Domain
- data-visualization
- Issue type
- Bug
- Difficulty
- 4/5
- Estimated time
- 3-5 days
- Activity status
- Stale
- Clarity
- Mostly clear
- Newbie friendliness
- 35/100