Feature request: Add different shapes to legend
- Dominant language
- JavaScript
- Stars
- 9.3k
- Forks
- 1.4k
- Avg merge
- 6d 16h
- Merged PRs (30d)
- 1
Description
It would be great if you could configure legend shapes for different data series. For example, for a line with markers it would be a line with marker on it, for a column it would be a square, for a line without any markers it would be just a line, for scatter plot it would be circles. You could see on examples below how it might look like:
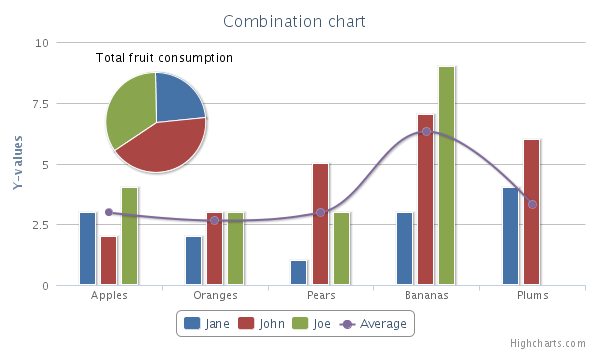
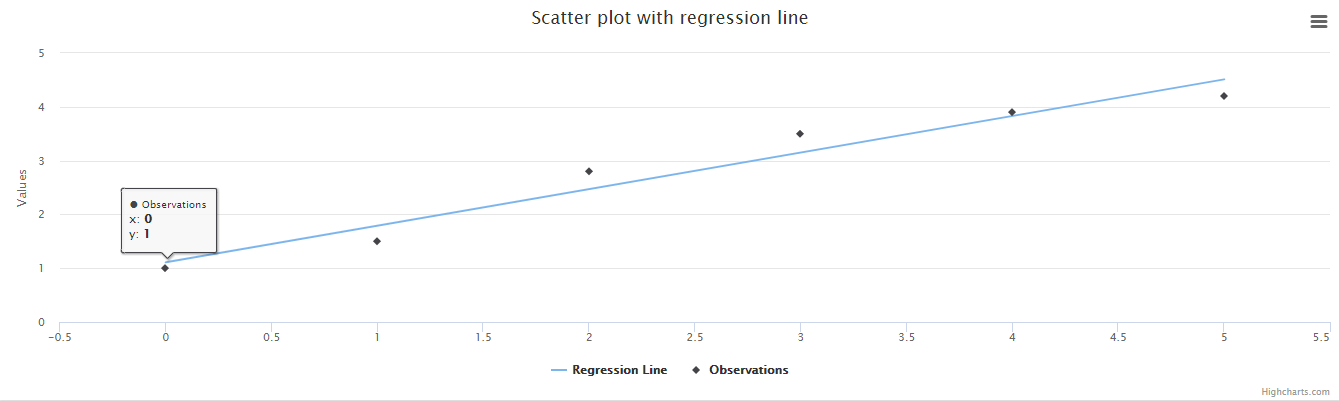
I can imagine one example where it will be definitely useful - black and white printing. It won't work with just columns or just lines, but it will be exactly better than now.
Contributor guide
Assessment
This issue has not been assessed yet.