Area chart shows extra grid lines on x-axis.
Open
- Dominant language
- JavaScript
- Stars
- 9.3k
- Forks
- 1.4k
- Avg merge
- 6d 16h
- Merged PRs (30d)
- 1
Description
I am using area chart and have enabled grid lines for x-axis. There are 7 values on the x-axis, but it shows 13 grid lines( one additional between between ticks). How can I get rid of these extra grid line and have only 7 grid lines i.e., one each for the ticks?
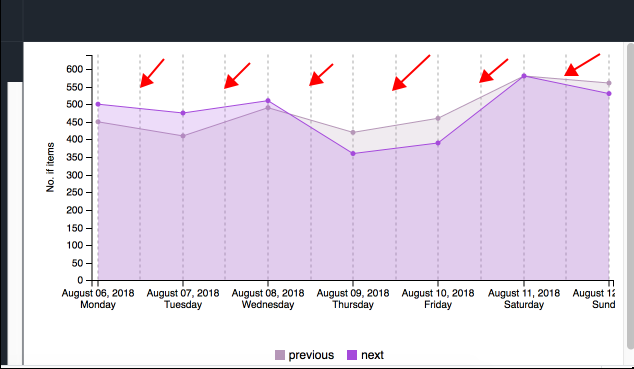
The lines with red arrows pointing to it are extra lines. How can they be avoided?
Here is the js fiddle with the issue.
[https://jsfiddle.net/KalyaniRaut/3qgw18xm/1/](https://jsfiddle.net/KalyaniRaut/3qgw18xm/1/)
I am using "react-c3js": "0.1.20"
Contributor guide
Assessment
This issue has not been assessed yet.