Subchart + modifying axes causes lines to overflow x-range
Open
- Dominant language
- JavaScript
- Stars
- 9.3k
- Forks
- 1.4k
- Avg merge
- 6d 16h
- Merged PRs (30d)
- 1
Description
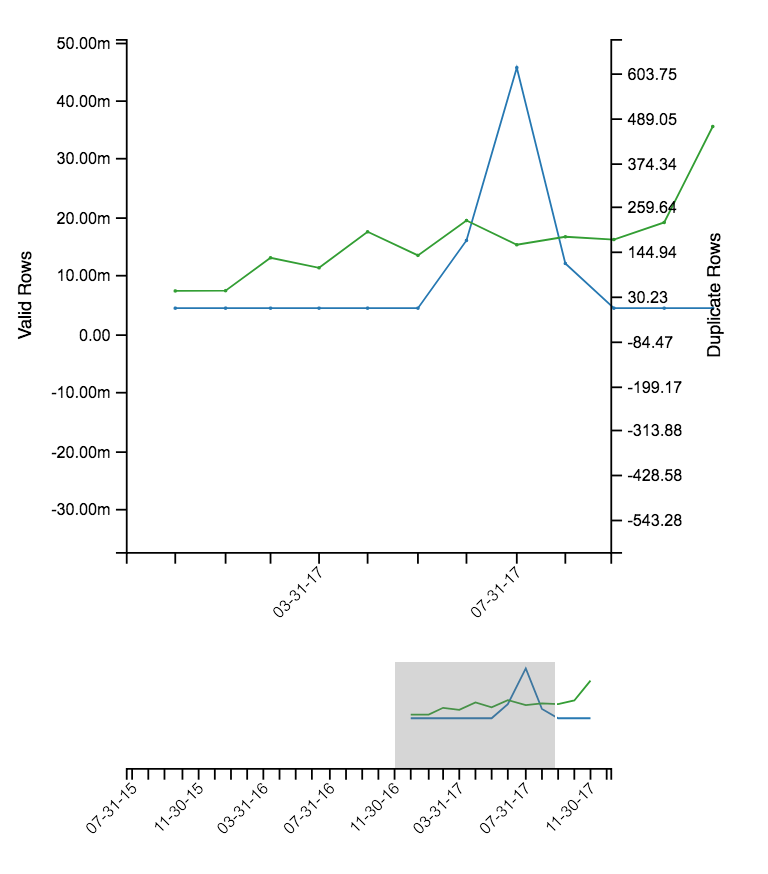
Note the line crossing over the right side of the x-axis. This occurs when zooming in using a subchart, and updating the y-axis min and max via the chart API's.
Contributor guide
Research direction
Start by reproducing the issue with a subchart zoom followed by chart API updates to the y-axis minimum and maximum. Trace the axis and x-range handling around that sequence; done means the line no longer crosses beyond the right side of the x-axis.
Written by the indexing model from the issue text.
Assessment
- Tech stack
- javascript
- Domain
- data-visualization
- Issue type
- Bug
- Difficulty
- 4/5
- Estimated time
- 3-5 days
- Activity status
- Stale
- Clarity
- Mostly clear
- Newbie friendliness
- 35/100