subchart and zoom features cause tick labels to overflow x-axis
Open
- Dominant language
- JavaScript
- Stars
- 9.3k
- Forks
- 1.4k
- Avg merge
- 6d 16h
- Merged PRs (30d)
- 1
Description
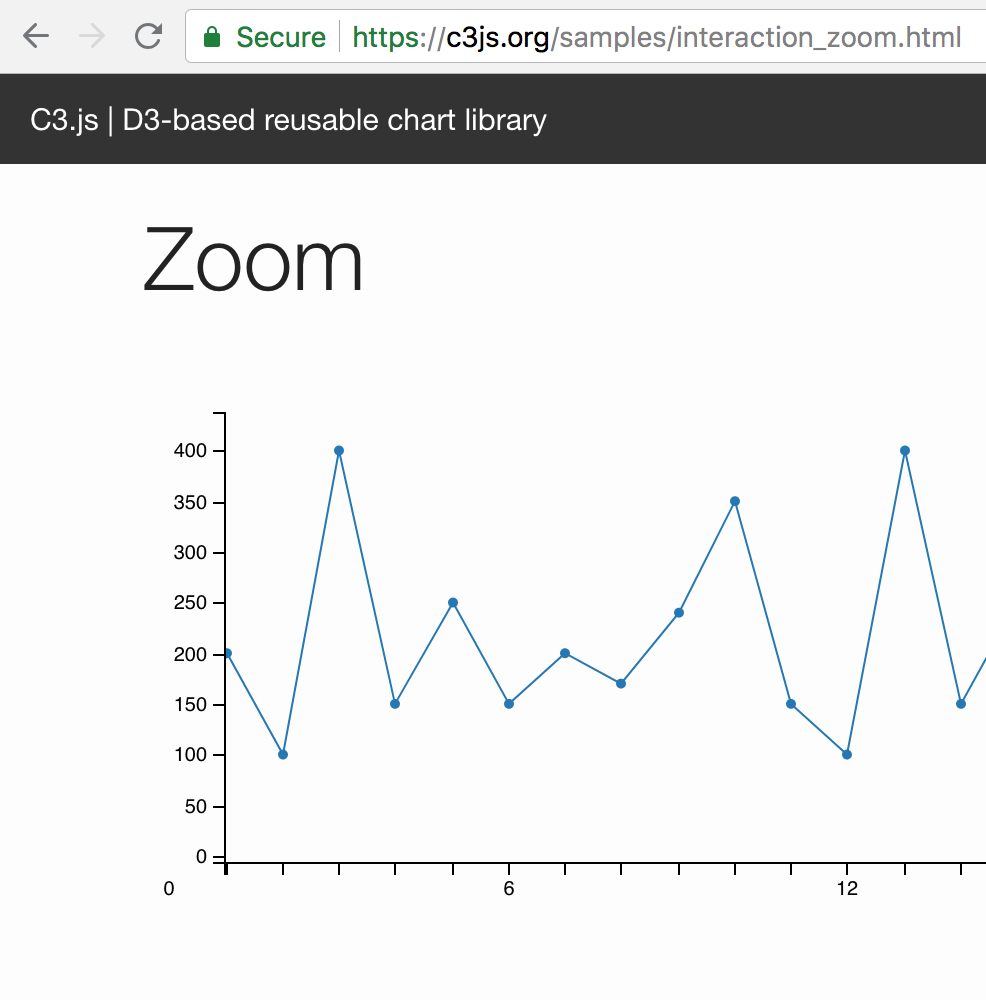
These are screenshots from the examples section of the c3 site. Note how the "0" label overflows the x-axis on the left side.

Likewise with the zoom feature:
Contributor guide
Assessment
This issue has not been assessed yet.