stacked bar chart with overlap per category
- Dominant language
- JavaScript
- Stars
- 9.3k
- Forks
- 1.4k
- Avg merge
- 6d 16h
- Merged PRs (30d)
- 1
Description
Hi,
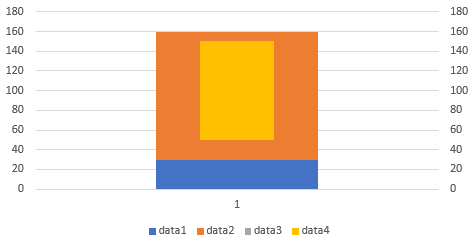
I want to get the second data group (data3, data4) overlapping the first data group (data1, data2) in order to see both in one stacked bar chart.
That brings me to following requirements for data group (data3, data4):
- [ ] must be on y2 axis based on data group value and not on single data 3 or 4
- [ ] must be overlapped with data group (data1, data2) and formatted thinner
- [ ] data 3 must be formatted transparrent
(see Excel-screenshot below)
var chart = c3.generate({
data: {
columns: [
['data1', 30],
['data2', 130],
['data3', 50],
['data4', 100]
],
type: 'bar',
groups: [
['data1', 'data2'], ['data3', 'data4']
]
},
});
C3 version: 0.5.4
D3 version: d3.v5.min.js
Browser: Version 66.0.3359.139 (Offizieller Build) (64-Bit)
OS: Windows 10
thanks for all supports
Michael
Contributor guide
Research direction
Start at the c3.generate entry point and reproduce the supplied grouped bar example with the two data groups. Define how the second group should use a group-based y2 axis, overlap the first group, render thinner bars, and make data3 transparent; done means all three stated requirements work together in the chart.
Written by the indexing model from the issue text.
Assessment
- Tech stack
- d3, javascript
- Domain
- data-visualization
- Issue type
- Feature
- Difficulty
- 5/5
- Estimated time
- Over a week
- Activity status
- Stale
- Clarity
- Mostly clear
- Newbie friendliness
- 30/100