[0.4.21] Gauge Chart scales incorrectly when all labels are hidden
- Dominant language
- JavaScript
- Stars
- 9.3k
- Forks
- 1.4k
- Avg merge
- 6d 16h
- Merged PRs (30d)
- 1
Description
C3 version: 0.4.21
D3 version: 3.5.17
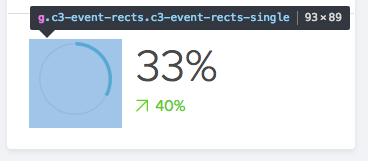
After a recent update to 0.4.21 it seems that full circle Gauge Chart started to display incorrectly when all its labels are hidden.
Config:
```javascript
c3.generate({
size: {
height: 93,
width: 93
},
legend: {
show: false
},
data: {
type: 'gauge'
},
gauge: {
width: 4.5,
expand: false,
fullCircle: true,
startingAngle: 2 * Math.PI,
label: {
show: false
}
}
})
```
Before update:
After update:
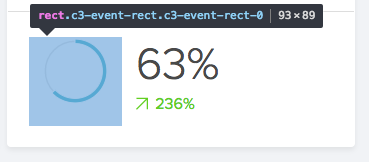
I suspect the changes in this commit 8780cdd4aac91334fddb6131dad3ed7972de2345 are the problem.
The lines https://github.com/c3js/c3/commit/8780cdd4aac91334fddb6131dad3ed7972de2345#diff-a88a43467d0fb57fc0542b3e9341cdf2R1802 and https://github.com/c3js/c3/commit/8780cdd4aac91334fddb6131dad3ed7972de2345#diff-a88a43467d0fb57fc0542b3e9341cdf2R4350 don't seem to check if labels are being shown at all before rescaling the chart.
Contributor guide
Assessment
This issue has not been assessed yet.