Chart Bar incorrectly appears in full length (100% Value) upon hiding more then one keys
- Dominant language
- JavaScript
- Stars
- 9.3k
- Forks
- 1.4k
- Avg merge
- 6d 16h
- Merged PRs (30d)
- 1
Description
Trying this code:
```
$window.c3.generate({
bindto: '#' + scope.bindId,
data: {
json: newData,
axes: {
budget: 'y2'
},
keys: {
x: 'date',
value: ['impressions', 'clicks', 'videoCompletions', 'visits', 'conversions', 'budget']
},
hide: ['videoCompletions', 'clicks', 'visits', 'conversions'],
```
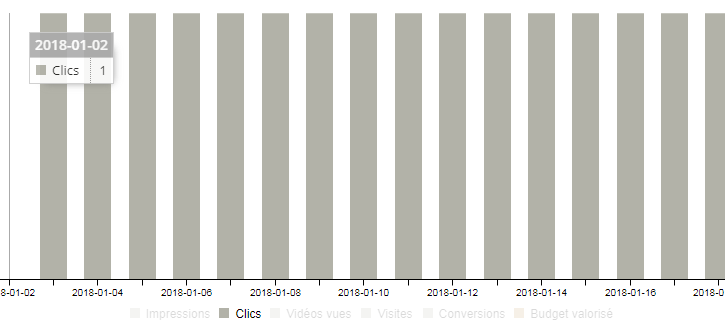
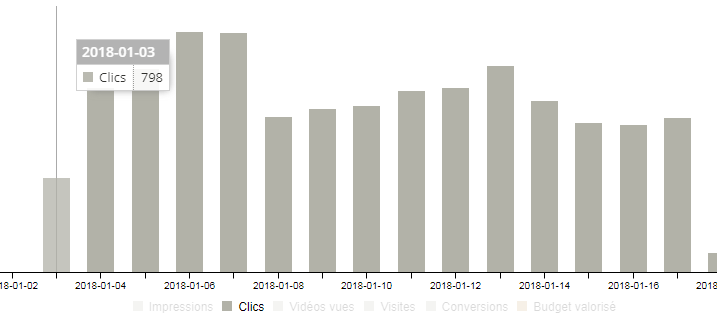
This causes bars hidden to be incorrectly displayed as 100% values on Bar Graph.
Tried onrendered, chart.flush(), chart.resize(), version 0.4.18 & 0.4.14 but issue persists
Current Value:
Expected Value:
Contributor guide
Assessment
This issue has not been assessed yet.