Applying axis.y.default with zero values with line or bar chart
- Dominant language
- JavaScript
- Stars
- 9.3k
- Forks
- 1.4k
- Avg merge
- 6d 16h
- Merged PRs (30d)
- 1
Description
C3 version: 0.4.18
D3 version: 3.5.6.
Browser: Chrome 63.0.3239.84 (but occurs any version)
OS: MacOS 10.13.2
This is rather enhancement then bug.
I wanted to make charts like Google's Analytics when there is only zero value's data.
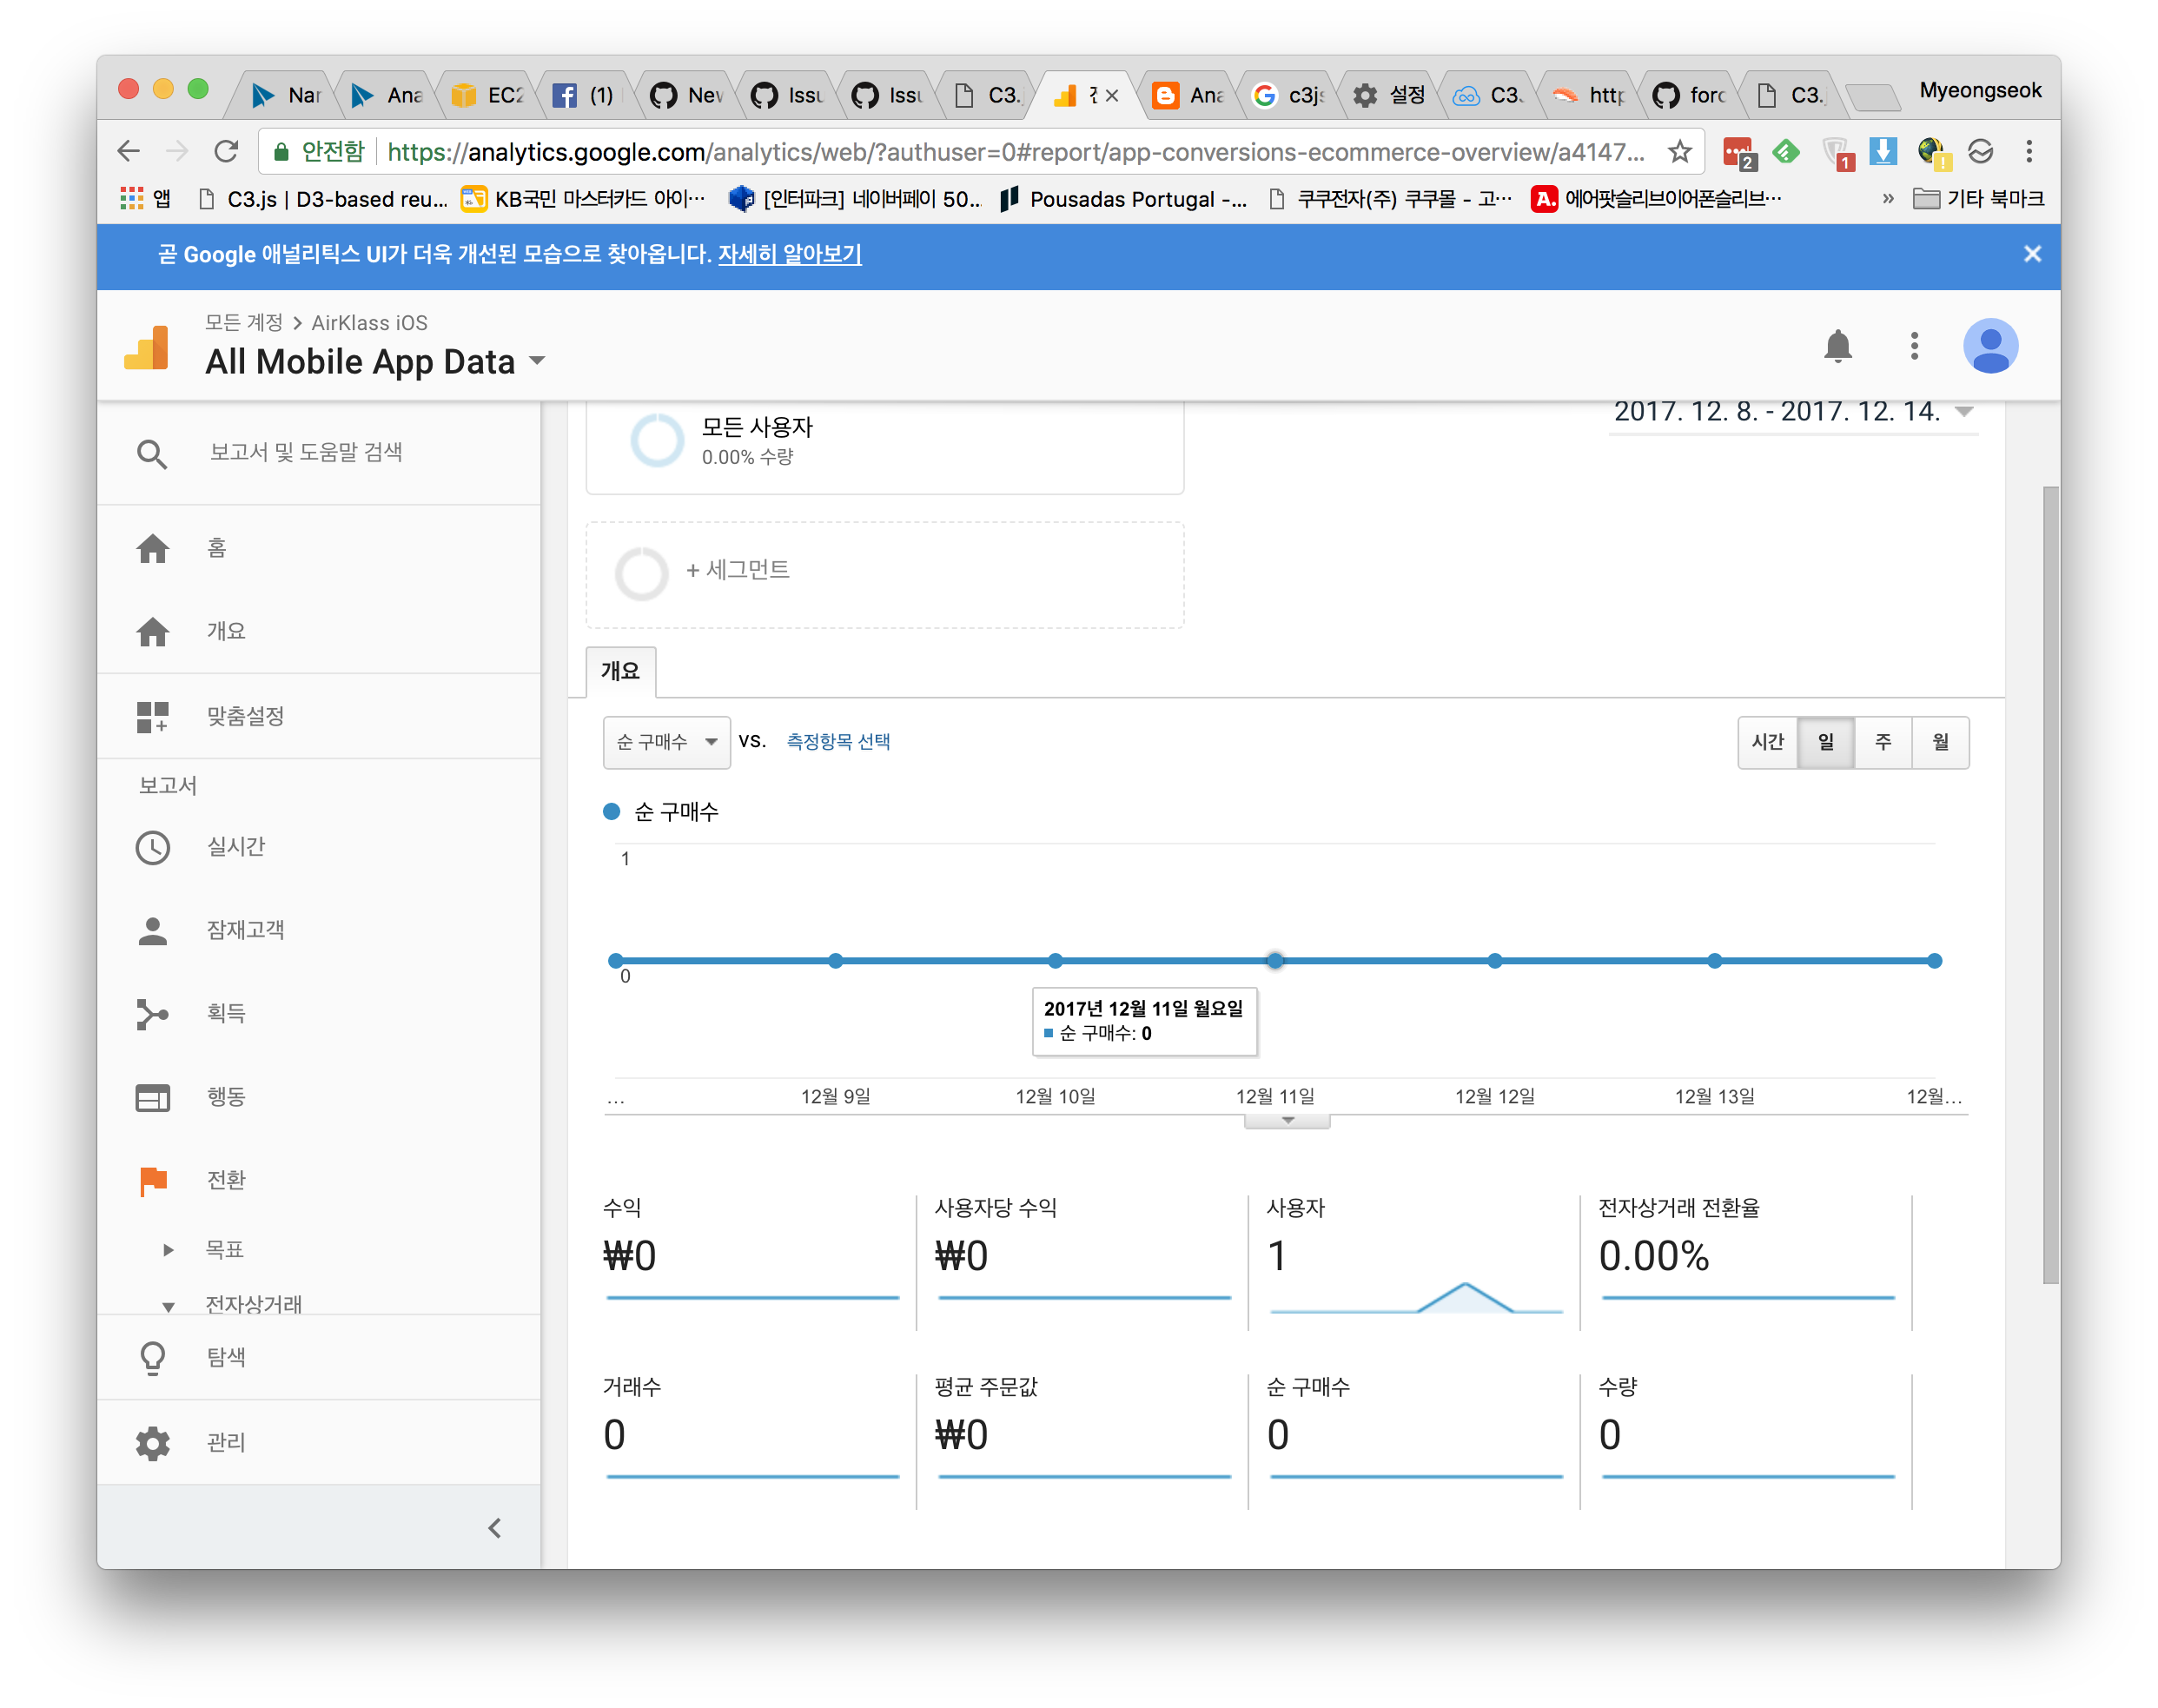
They set chart's y axis rage by [1, -1] when there's only zero values.
So line is centered and showing lines.
But when using c3js,
https://jsfiddle.net/clichedmoog/fup6L6nu/4/
As shown chart1
When drawing line or bar chart with zero values it seems not showing much values because the range of y axis not defined yet.
As shown chart2
If I set a range the data shown normally. and the padding also effective because there is range of y axis.
In this case, I can check all values are zero and set the range of y axis.
but, how about using axis.y.default setting to show range of y axis like chart3?
Contributor guide
Assessment
This issue has not been assessed yet.