Clicking the sub chart inverses the columns in the main chart
- Dominant language
- JavaScript
- Stars
- 9.3k
- Forks
- 1.4k
- Avg merge
- 6d 16h
- Merged PRs (30d)
- 1
Description
Zooming/scrolling the sub chart inverses the columns in the main chart. Sometime it is just enough to click anywhere (a single click) within the sub chart area to trigger the issue. The issue seems to be intermittent in nature, but can be consistently reproduced:
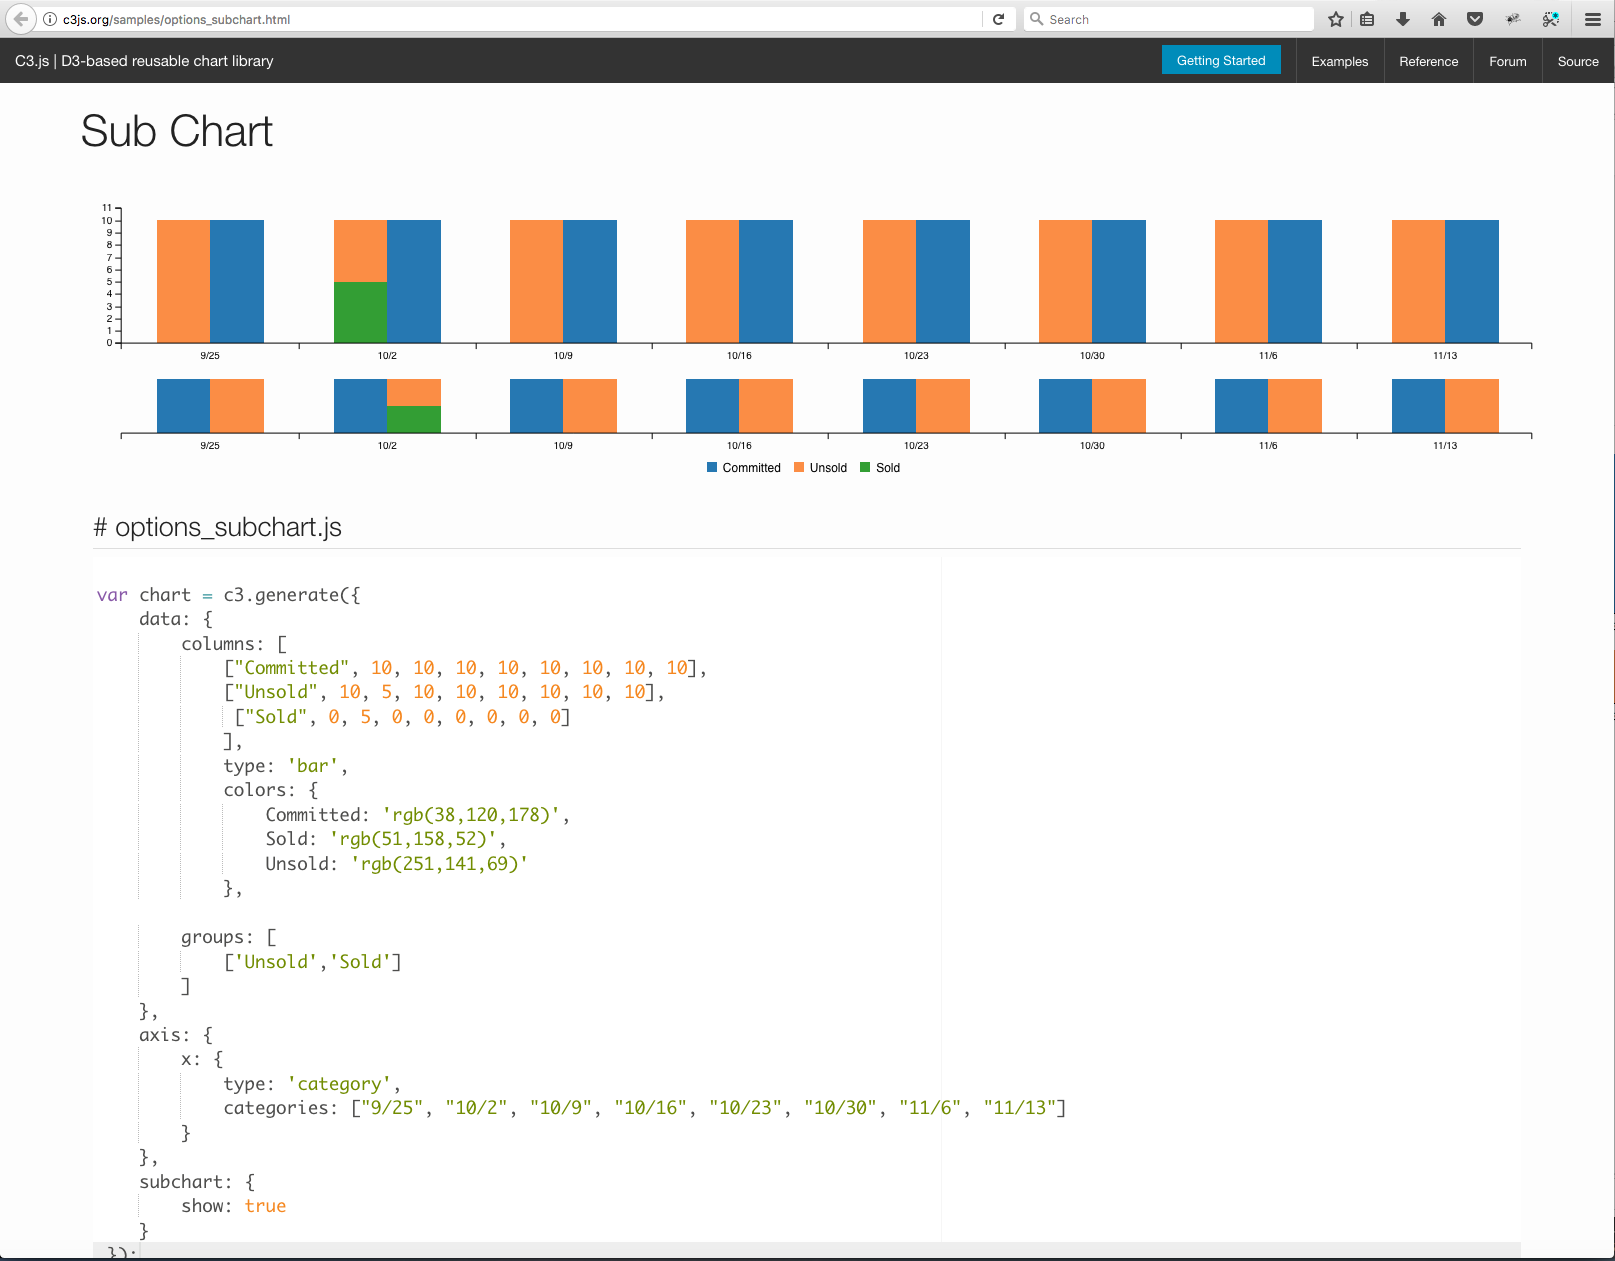
I have created a [JSFiddle ](http://jsfiddle.net/ousfqcx3) with the code that can be used to duplicate the issue.
Sometime the issue is triggered immediately, on a first click, but most of the times it is sporadic. It may be more easier to reproduce it on Safari or Firefox.
* **C3 0.4.17 & 0.4.18**:
* **D3 3.5.17**:
* **Firefox, Safari, Chrome**:
* **macOS Sierra 10.12.6**:
Contributor guide
Assessment
This issue has not been assessed yet.