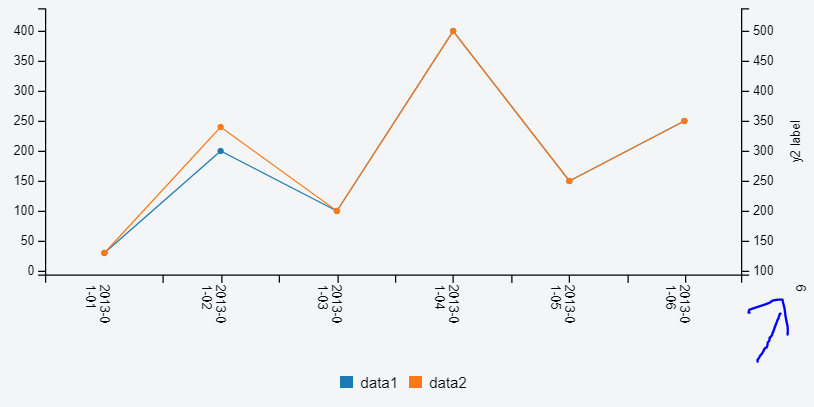
X axis tick count unexpectedly displaying
- Dominant language
- JavaScript
- Stars
- 9.3k
- Forks
- 1.4k
- Avg merge
- 6d 16h
- Merged PRs (30d)
- 1
Description
For some reason, the X axis tick count displays to the right of the x-axis when certain settings are set. Is there a way to turn this off? I couldn't find it in the documentation or bug list, but perhaps I missed something. No error displays in Developer Tools.
Settings that affect whether tick count displays:
- y2 label displayed with position 'outer-middle'
- category instead of timeseries selected for x-axis
- fit false
[Fiddle link](http://jsfiddle.net/dbkidd/3syLfxr4/)
In the fiddle, I made notes about which lines do and don't affect the issue. Also, I made the x-axis label have rotate set so it's easy to see the count is associated with it. I've seen this in Chrome and Firefox both in the Fiddle and my own code, both with C3 version "0.4.18."
Contributor guide
Assessment
This issue has not been assessed yet.