Named groups per tick
- Dominant language
- JavaScript
- Stars
- 9.3k
- Forks
- 1.4k
- Avg merge
- 6d 16h
- Merged PRs (30d)
- 1
Description
* **C3 version**: 0.4.18
* **D3 version**: 3.5.17
* **Browser**: Chrome
* **OS**: macOS
I've been using c3 for a variety of charts and thus far have had great success in using it without a lot of hassle. Thanks a lot!
However, I'm now looking to produce the following:
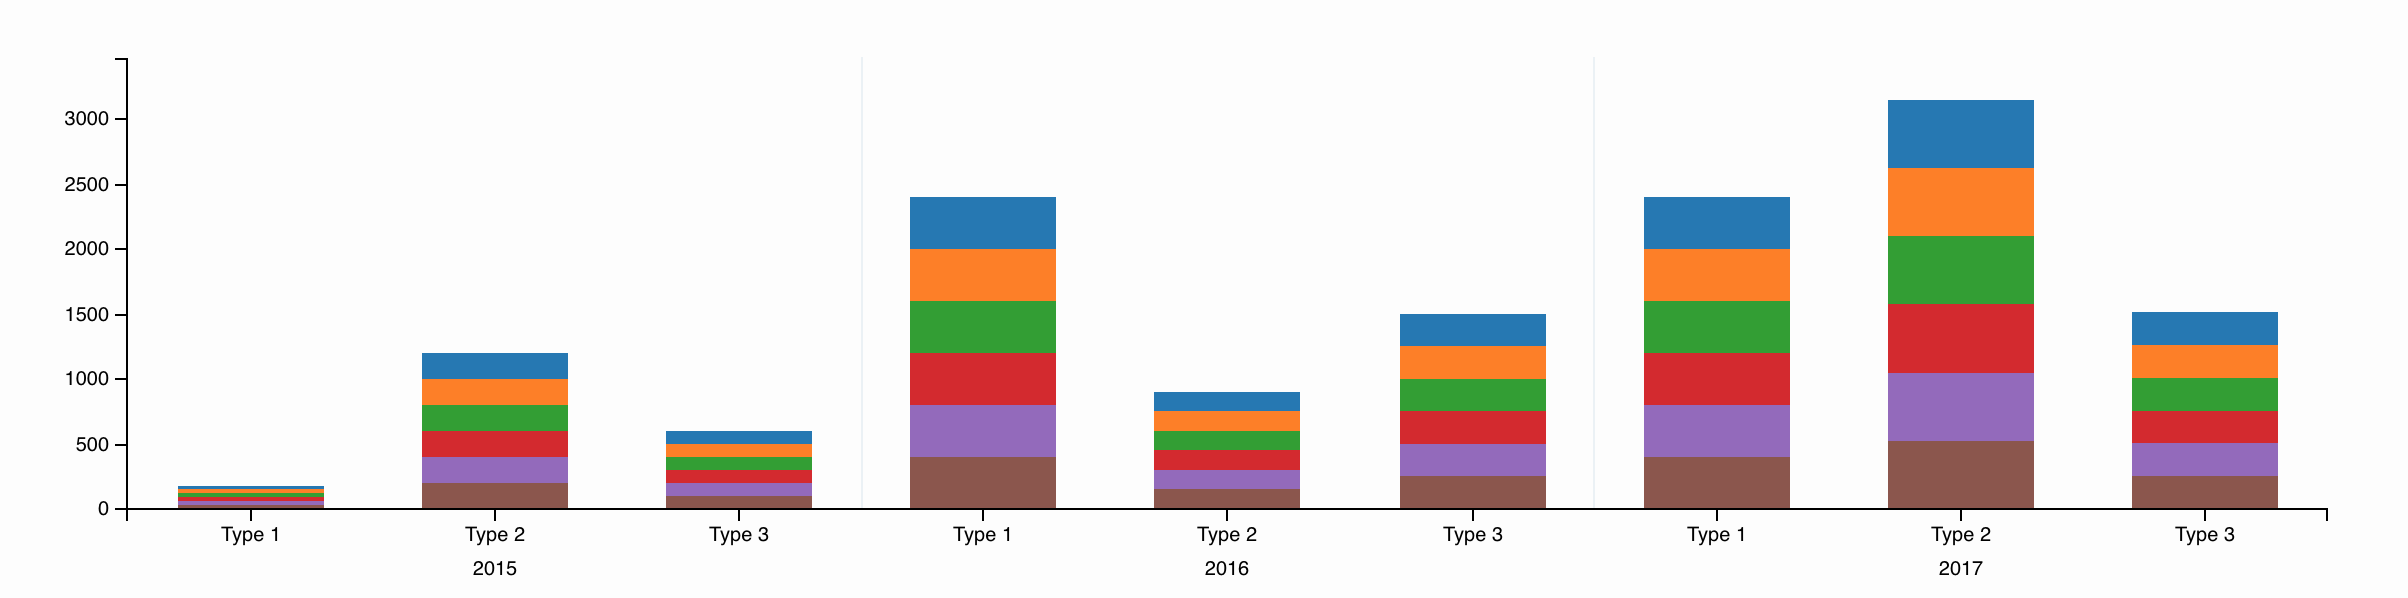
This is a set of discrete data which is split by year, then grouped by a type where each value is a separate provider.
I've managed to produce the above in what I consider to be a very hacky way, which involves adding additional elements to the SVG and repurposing regions for dividing lines. I've created [a codepen of my implementation](https://codepen.io/andrewbridge/pen/GMevMz?editors=0010)
In a perfect world, I'd hope to be able to give
```json
{
"data": {
"json": {
"2015": {
"Type 1": {
"Provider 1": 54,
"Provider 2": 134
},
"Type 2": {
"Provider 1": 24,
"Provider 2": 195
}
},
"2016": {
"Type 1": {
"Provider 1": 515,
"Provider 2": 52
},
"Type 2": {
"Provider 1": 62,
"Provider 2": 300
}
}
}
}
```
to c3 and it'd infer the various groupings at both levels, but I'm unsure if this would have knock on effects elsewhere.
I've begun looking at adding this functionality myself, but as per the README and contribution guidelines, I'm adding this issue to see if this functionality is desired, possible while maintaining compatibility with other use cases and, assuming it is, whether there are any pointers on the best way of doing this in terms of best practices in the codebase and any routes that may be more performant than others.
Any information or suggestions on doing what I need without any enhancement to the library are all much appreciated.
Contributor guide
Research direction
Start with the README and contribution guidelines, then inspect the data configuration and grouping behavior used by the codepen example. Determine whether nested JSON can express year, type, and provider groups without breaking existing use cases, and define the expected chart output and compatibility checks before proposing an implementation.
Written by the indexing model from the issue text.
Assessment
- Tech stack
- d3, javascript
- Domain
- data-visualization
- Issue type
- Feature
- Difficulty
- 5/5
- Estimated time
- Over a week
- Activity status
- Stale
- Clarity
- Mostly clear
- Newbie friendliness
- 30/100