Enabling zoom causing errors on double click of the line chart
- Dominant language
- JavaScript
- Stars
- 9.3k
- Forks
- 1.4k
- Avg merge
- 6d 16h
- Merged PRs (30d)
- 1
Description
Hi,
I'm trying to use zoom functionality with the line chart.
Following my chart configuration.
```
{
axis: {
x: {
tick: {
format: date => {
return this.formateX(date as Date);
},
multiline: false
},
type: "timeseries"
},
y: {
tick: {
format: d => (+d.toFixed(2)) + "h"
}
}
},
bindto: element,
data: {
json: graphData,
type: "line"
},
legend: {
show: false
},
point: {
show: false
},
zoom: {
enabled: true
}
}
```
I'm able to generate line chart with the above configuration, but not able to zoom the chart by double click on any point of the line.
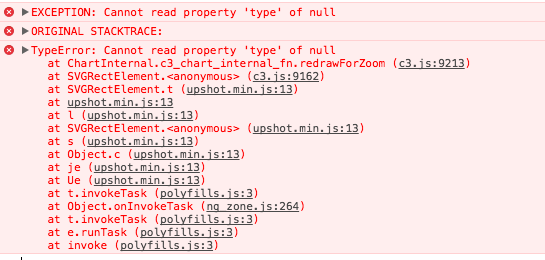
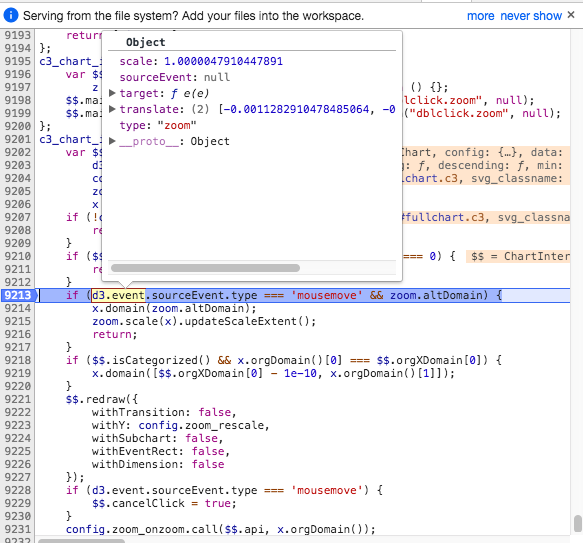
Console says following error:
**Updated:**
JSFiddle: https://jsfiddle.net/q28bo33g/
* **C3 version**: 0.4.11
* **D3 version**: 3.5.7
* **Browser**: Chrome 61.0
* **OS**: MAC
Contributor guide
Assessment
This issue has not been assessed yet.