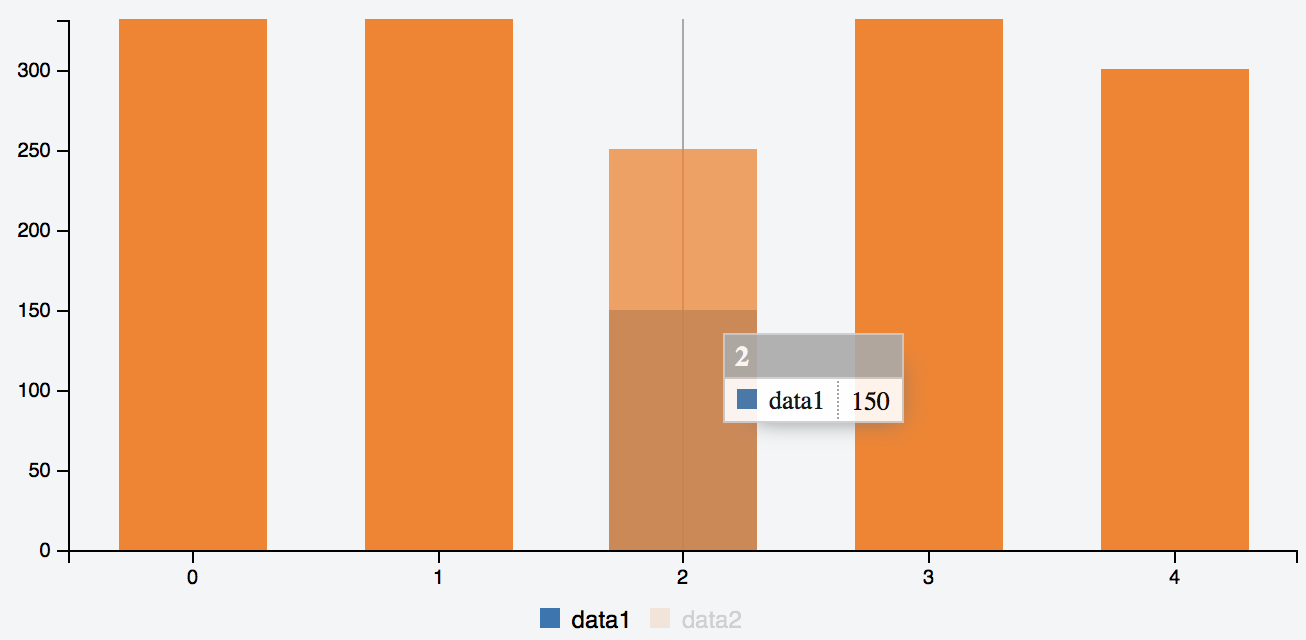
Incorrect drawing bar chart with data hide when init since v0.4.15
Open
- Dominant language
- JavaScript
- Stars
- 9.3k
- Forks
- 1.4k
- Avg merge
- 6d 16h
- Merged PRs (30d)
- 1
Description
## What version of C3?
- v0.4.15
- This problem was not produced at v0.4.14
## Reproduce code
fiddle: http://jsfiddle.net/p7q596yu/
```js
var chart = c3.generate({
data: {
type: 'bar',
columns: [
['data1', 100, 200, 150, 300, 200],
['data2', 400, 500, 250, 700, 300],
],
hide: ['data2']
}
});
```
### Rendered image
### Expected image

Contributor guide
Assessment
This issue has not been assessed yet.