bytecodealliance / bytecodealliance/wasmtime
Write `--profile` output using the `.cpuprofile` format in Wasmtime
- Dominant language
- Rust
- Stars
- 18.6k
- Forks
- 1.8k
- Avg merge
- 1d 18h
- Merged PRs (30d)
- 126
Description
#### Feature
Enable wasmtime to output CPU profiles in the VS Code-compatible `.cpuprofile` format.
#### Benefit
Right now wasmtime can take guest profiles using the `--profile=guest` flag, but these profiles are stored in [Firefox profiler's `.json` format](https://profiler.firefox.com). VS Code can natively render CPU profiles, but only using the `.cpuprofile` format. This is a JSON-based format, which shouldn't be too different from Wasmtime's existing output - but it would be neat if Wasmtime profiling support directly integrated with VS Code.
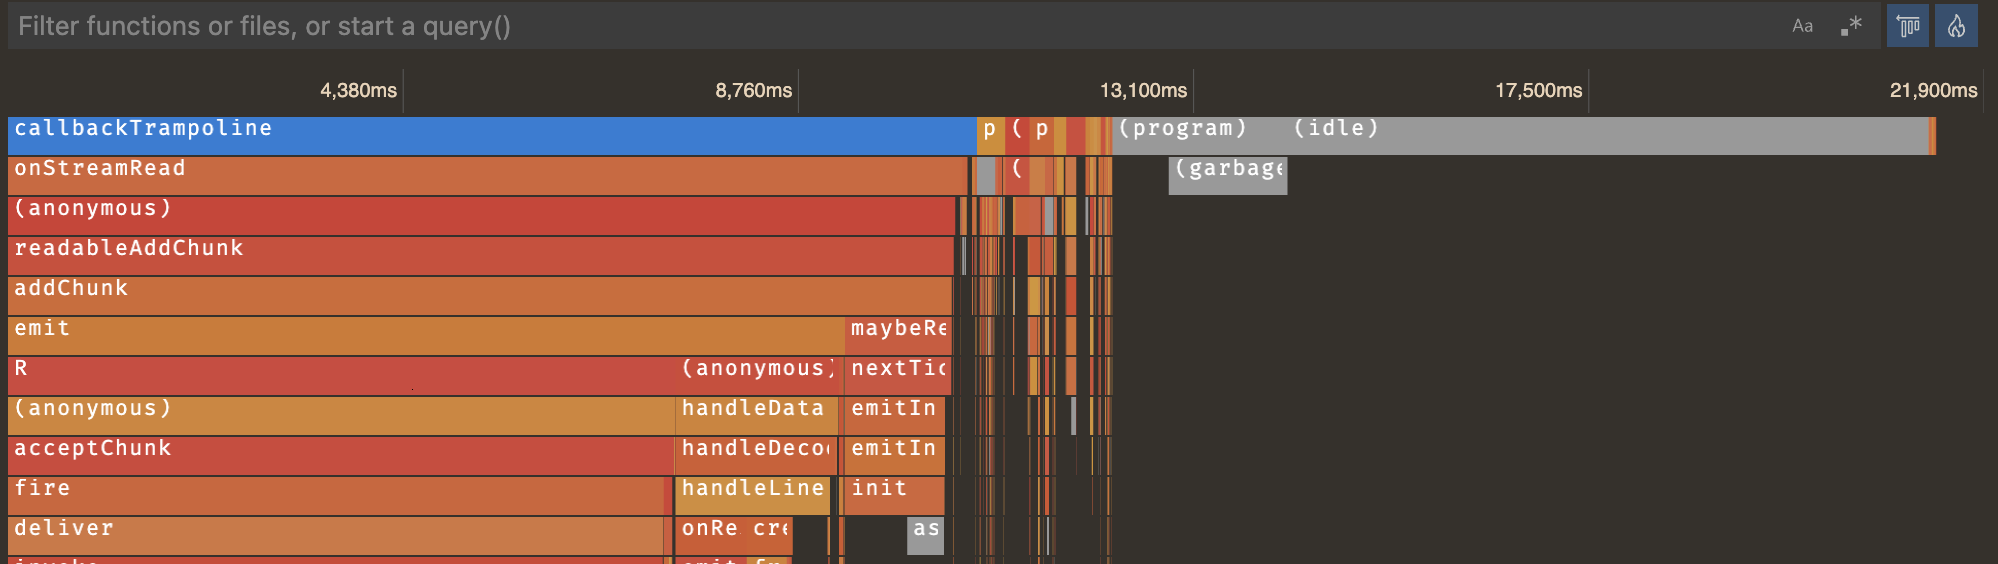
The flow I have in mind here is that we would add support for some `--profile` flag to language native toolchains. So that you could run e.g. `cargo test --profile`, or maybe even hit the `profile` button in VS Code - and then that outputs a performance profile which can be directly visualized in VS Code like so:
#### Implementation
Ideally we'd just switch over the existing profile format to `.cpuprofile`. That seems better than adding additional config - and I believe the Firefox profiler can already load those. I also don't think there is any loss of information if we do that?
If we can't do that, adding a flag could be another option. But it seems better to not add more config if we can help it. I think this should mostly just be a different way we encode the same information, so I imagine the change here should be fairly self-contained within Wasmtime.
#### Alternatives
The main alternative here would be to handle this in the language-native tooling, taking the existing output and rewriting it to the `.cpuprofile` format. But since I believe the `.cpuprofile` is equivalent to what Wasmtime outputs already, and also already appears to be supported by the Firefox profiler, it might be better to make this change directly in Wasmtime.
#### References
- [`.cpuprofile` schema (Chrome devtools)](https://chromedevtools.github.io/devtools-protocol/tot/Profiler/#type-Profile)
- [JS `.cpuprofile` reference schema](https://github.com/jantimon/cpuprofile-to-flamegraph/blob/b09767d1a4b87fc2b3122630fd485a93885b7fa2/src/index.ts#L7-L74)
- [analyzing profiles in VS Code (VS Code docs)](https://code.visualstudio.com/docs/nodejs/profiling#_analyzing-a-profile)
- [firefox profiler](https://profiler.firefox.com)
Contributor guide
Assessment
This issue has not been assessed yet.