Incorrect image load times reported in logcat when 1000s of images are downloaded in background?
- Dominant language
- Java
- Stars
- 35k
- Forks
- 6.2k
- Avg merge
- 1d 11h
- Merged PRs (30d)
- 8
Description
**Glide Version**: 4.8.0
**Integration libraries**: OkHttp 3.13.0 (Dependency already included in app for use with retrofit 2.4.0)
**Device/Android Version**: Emulator for Android 10
**Issue details / Repro steps / Use case background**:
- Use case: 1000s of images to be downloaded in background for offline use.
- The URLs are prepared in advance and submitted to Glide
- Thousands of requests are submitted in a for loop via **requestManager.download.submit()**
- The downloads are queued started in a thread pool. (as it seems)
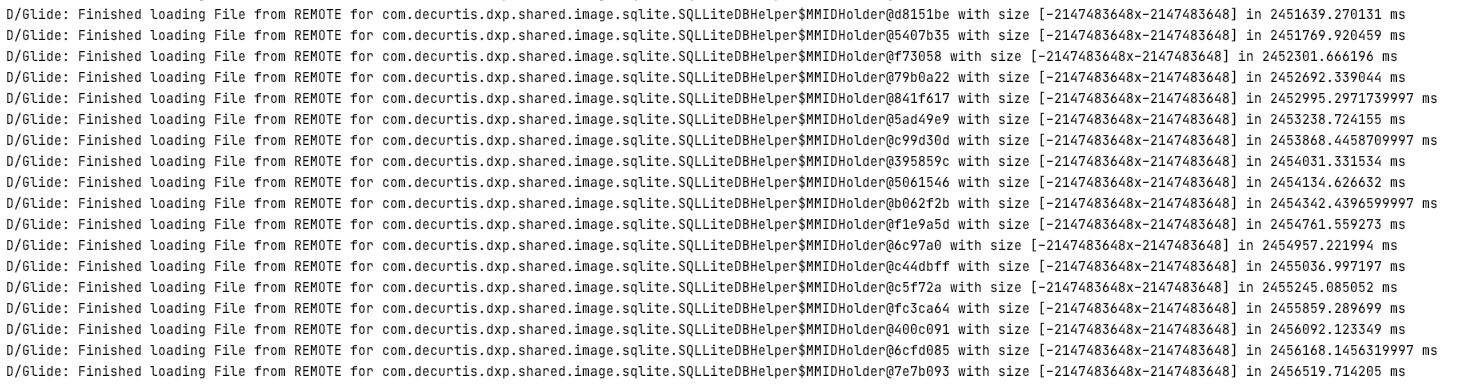
- Log statements start to come, and the initial load times seem to be the time taken by the server to respond to each request. But as thousands of images continue to get downloaded, the time shown in logcat continues to increase indicating that the server is responding slow.
- But later as the time passes (15 minutes or so), it seems as the time reported is not time taken by server to respond, **but the duration from when the request was submitted, till when it actually got executed.**
- Need to confirm if this ^ is the case. (screenshot attached below)
**Stack trace / LogCat**:
Contributor guide
Research direction
Start with the requestManager.download.submit() entry point and reproduce the queued-download scenario using thousands of image URLs. Inspect the Logcat timing reported as requests move through the thread pool, comparing it with server response time. Done means confirming whether the log measures queue wait or network response duration and correcting the reported value if it is wrong.
Written by the indexing model from the issue text.
Assessment
- Tech stack
- java
- Domain
- performance
- Issue type
- Bug
- Difficulty
- 3/5
- Estimated time
- 1-2 days
- Activity status
- Stale
- Clarity
- Mostly clear
- Newbie friendliness
- 35/100