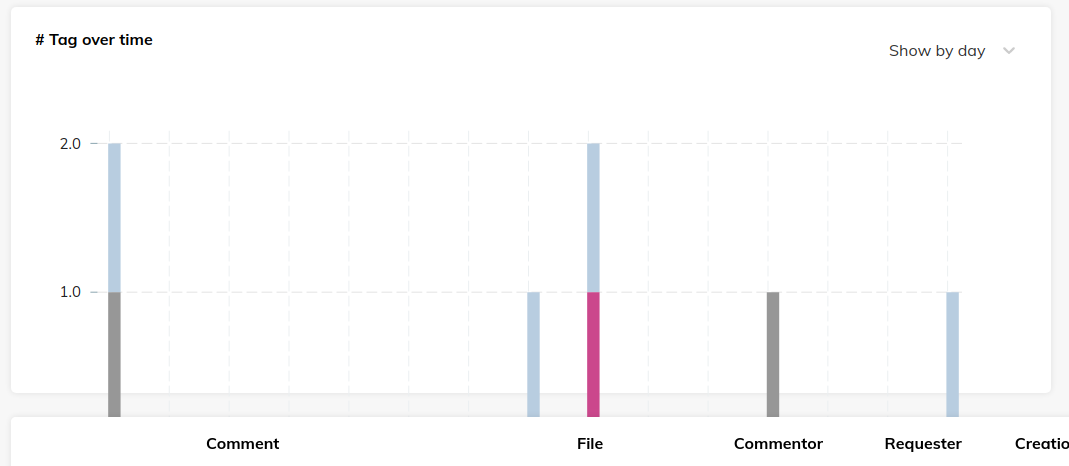
[UI] The graph does not scale well on all screens.
Open
- Dominant language
- TypeScript
- Stars
- 45
- Forks
- 1
- PR merge metrics
- No merged PRs in 30d
Description
If the screen is too wide, the timeline graph gets out of its container, thus hiding the x axis.
The screen size of the following screenshot: 1920 - 1080 (16:9) according to my settings.
Contributor guide
Research direction
Reproduce the issue at 1920×1080 and inspect how the timeline graph relates to its container and x axis. Confirm the graph remains within its container and the x axis stays visible on wide screens.
Written by the indexing model from the issue text.
Assessment
- Tech stack
- typescript
- Domain
- data-visualization, frontend
- Issue type
- Bug
- Difficulty
- 3/5
- Estimated time
- 1-2 days
- Activity status
- Stale
- Clarity
- Mostly clear
- Newbie friendliness
- 42/100