aws / aws/sagemaker-experiments
[Feature] Add plots for regression
- Dominant language
- Python
- Stars
- 129
- Forks
- 36
- PR merge metrics
- No merged PRs in 30d
Description
**Is your feature request related to a problem? Please describe.**
Not related to a problem.
**Describe the solution you'd like**
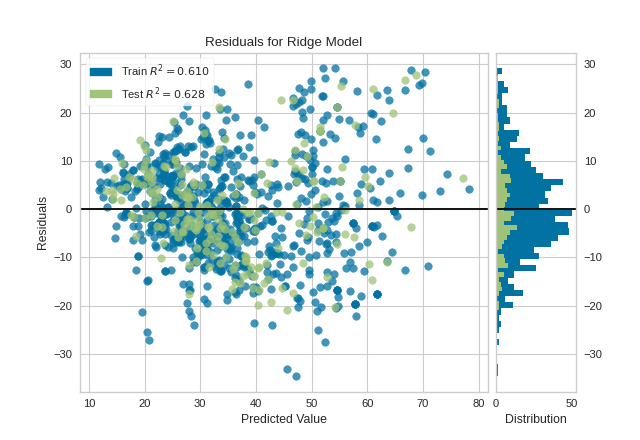
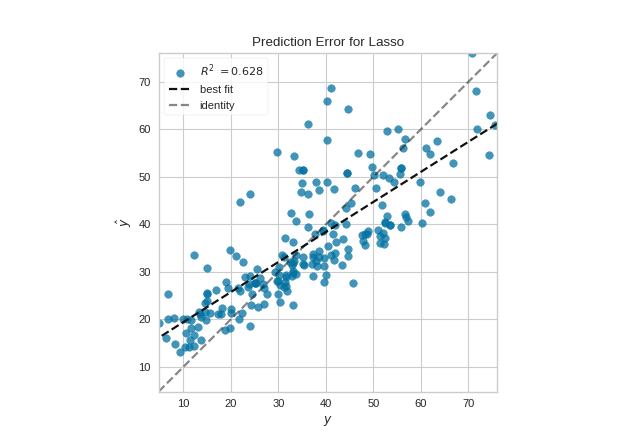
I'd like to have plots for regression such as:
- `residual plot(y_predicted, residuals)`
- `prediction error(y_true, y_predicted)`
**Describe alternatives you've considered**
I have been using `yellowbrick` for when I train scikit-learn models:
- [Residuals Plot](https://www.scikit-yb.org/en/latest/api/regressor/residuals.html)
- [Prediction Error Plot](https://www.scikit-yb.org/en/latest/api/regressor/peplot.html)
I'd like to have similar interpretation when using SageMaker Studio/Pipelines.
**Additional context**
Contributor guide
Assessment
This issue has not been assessed yet.