Use real or realistic spectra for examples
- Dominant language
- Python
- Stars
- 204
- Forks
- 134
- Avg merge
- 12h 55m
- Merged PRs (30d)
- 1
Description
The spectrum in the following example doesn't really make sense - it'd be much better to use a spectrum that can also be plotted, so that the EW can also be shown graphically:
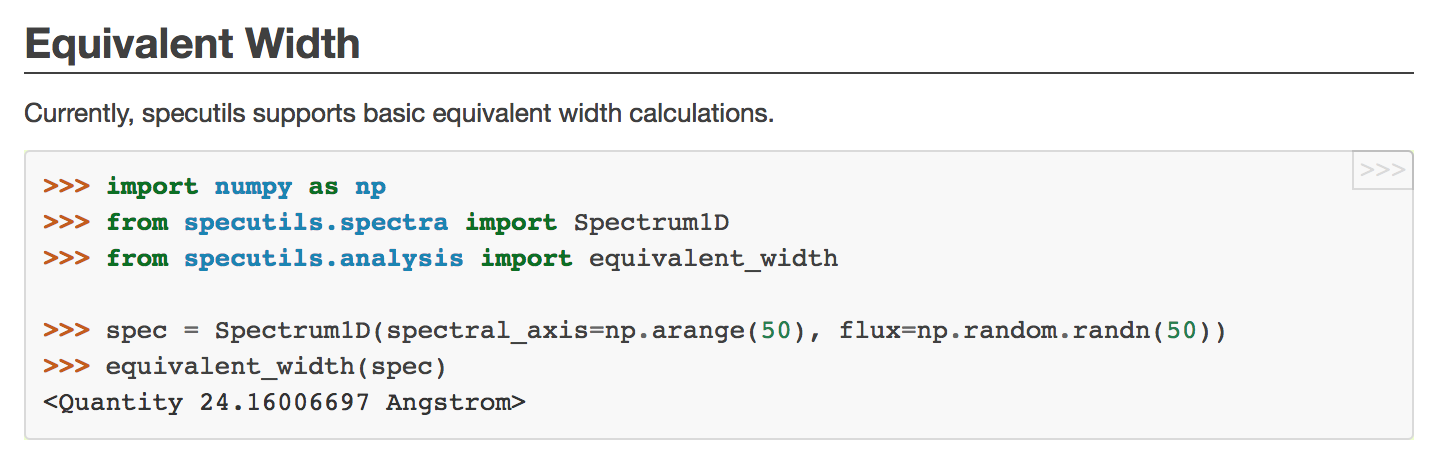
It might make sense to put a few standard spectra on data.astropy.org and use those consistently throughout.
This issue is not just about this example but all examples - I think all examples should use real spectra (or at least realistic) and should ideally include some plots so that the results from the examples make some sense.
Contributor guide
Research direction
No files or tests are named. Begin by inventorying every example that uses a spectrum, then assess how standard spectra could be hosted on data.astropy.org and reused consistently. Done means the examples use real or realistic spectra and show graphical results where appropriate.
Written by the indexing model from the issue text.
Assessment
- Tech stack
- python
- Domain
- documentation
- Issue type
- Feature
- Difficulty
- 5/5
- Estimated time
- Over a week
- Activity status
- Stale
- Clarity
- Needs clarification
- Newbie friendliness
- 25/100