[Bug][txn] exclusive subscription would lead to high cpu usage when do tailing-read
- Dominant language
- Java
- Stars
- 15.3k
- Forks
- 3.8k
- Avg merge
- 1d 14h
- Merged PRs (30d)
- 160
Description
### Search before asking
- [X] I searched in the [issues](https://github.com/apache/pulsar/issues) and found nothing similar.
- It seems this problem is the same as this pr described, https://github.com/apache/pulsar/pull/14286.
### Version
server and client version: pulsar-2.9.4
### Minimal reproduce step
do txn produce and txn consume on a 200-partition topic by pulsar-perf. The throughput is 10MB/s, batchSize is 10, subscriptionType is exclusive. It is a tailing read, consuming the latest message
produce config is :`-txn -nmt 1000 -time 0 -s 1024 -i 60 -bm 10 -b 1000 -bb 4194304 -r 10000 -mk random -threads 3`;
consume config is : `-txn -nmt 2000 -time 0 -i 60 -s sub_test_txn_p200 -ss sub_test_txn_p200 -sp Latest -ioThreads 1 -n 1`
### What did you expect to see?
The cpu usage should not be so high when it is exclusive subscription, tailing read and txn consume.
Actually the tailing read should not consume more resource than catchup read.
### What did you see instead?
1. when it is tailing read and exclusive subscription and txn consume, the cpu usage is 80%. But when it turn to catchup read, the cpu usage is 45%.
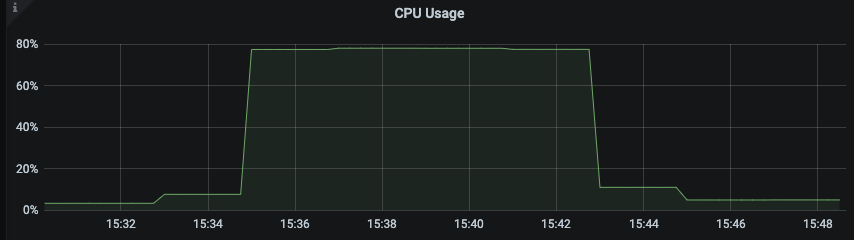
2. Throughput would not influence the cpu usage, but if topic have more partition, the cpu usage is higher.
3. 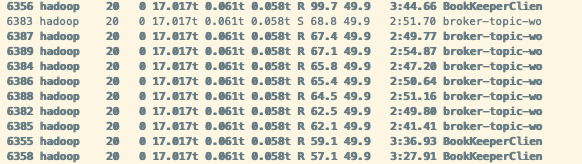
I add some log in code and have found the cpu is consumed in "broker-topic-workers", which is mostly do PersistentDispatcherSingleActiveConsumer#readEntriesComplete and PersistentDispatcherSingleActiveConsumer#dispatchEntriesToConsumer.
The problem is in PersistentDispatcherSingleActiveConsumer#dispatchEntriesToConsumer, then would invoke PersistentDispatcherSingleActiveConsumer#readMoreEntries and cursor.asyncReadEntriesOrWait
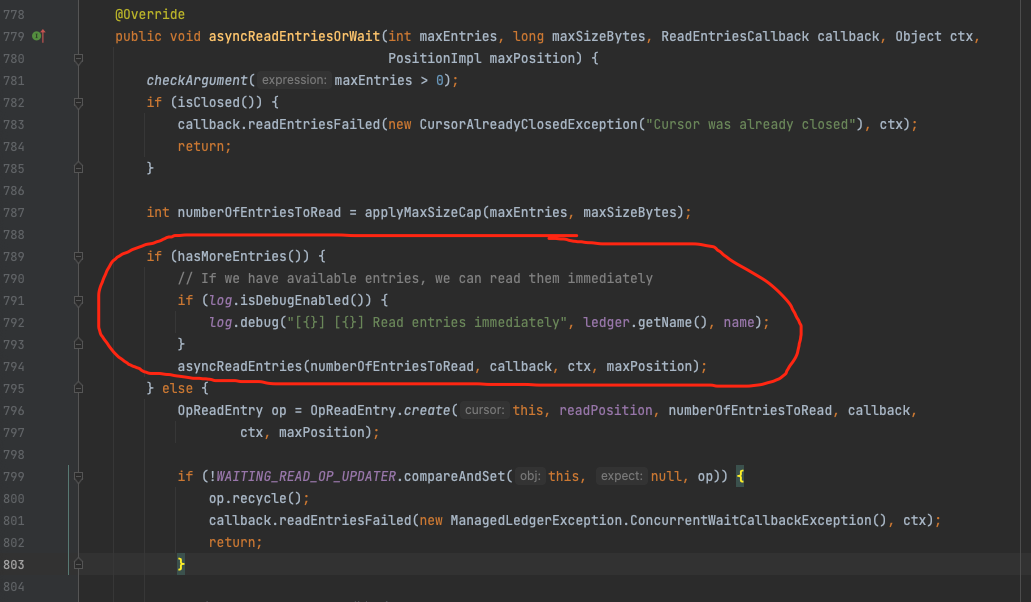
In cursor.asyncReadEntriesOrWait, more than 100K/s readEntryRequest would go into hasMoreEntries()=true, readPosition is less than writerPosition and then do asyncReadEntries(), which would invoke ManagedLedgerImpl#asyncReadEntries and ManagedLedgerImpl#internalReadFromLedger.
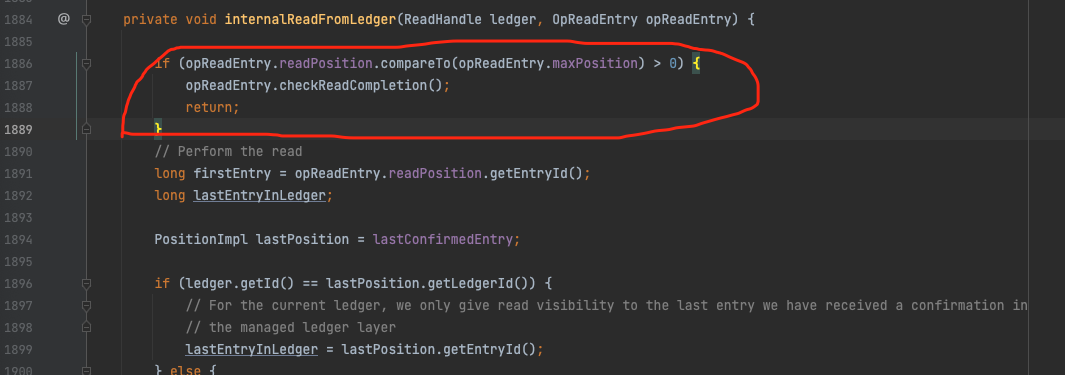
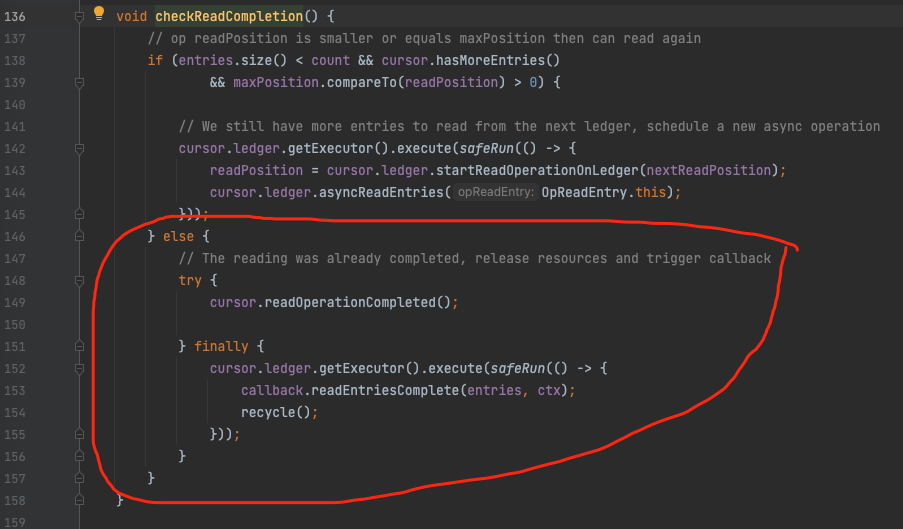
However, this multiple readEntryRequest would enter opReadEntry.checkReadCompletion() and then directly complete(). It seems like there are so many useless readEntryRequest is executed.
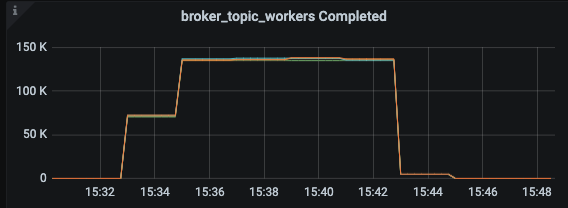
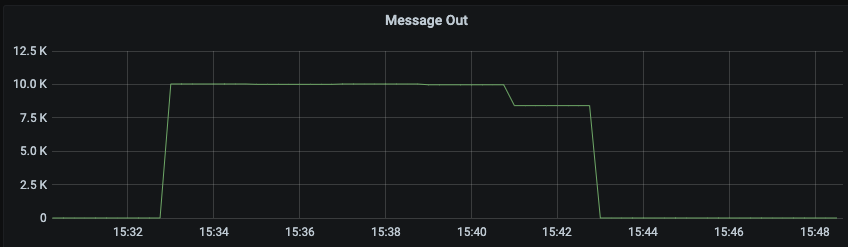
4. I also add a metric of thread pool "broker-topic-workers", and found that when do tailing read, the completed task in thread pool is total 150K * 8 thread = 1200K/s, while the read throughput is 10K message/s. There are too many task in this thread pool.
### Anything else?
Although tested in 2.9.4, I guess this problem may also occur in master branch.
### Are you willing to submit a PR?
- [ ] I'm willing to submit a PR!
Contributor guide
Research direction
Start by reproducing the tailing-read case with the supplied pulsar-perf producer and consumer settings on a 200-partition topic, then trace PersistentDispatcherSingleActiveConsumer#dispatchEntriesToConsumer and #readMoreEntries into cursor.asyncReadEntriesOrWait. Inspect ManagedLedgerImpl#asyncReadEntries and #internalReadFromLedger, especially the repeated readEntryRequest completion path. Done means eliminating the useless repeated requests and confirming lower broker-topic-workers CPU and task volume without changing catchup-read behavior.
Written by the indexing model from the issue text.
Assessment
- Tech stack
- java
- Domain
- distributed-systems
- Issue type
- Bug
- Difficulty
- 4/5
- Estimated time
- 3-5 days
- Activity status
- Stale
- Clarity
- Mostly clear
- Newbie friendliness
- 35/100