[Issue] The throttling is not exact for both publish and dispatch in pulsar-2.10.1 version
- Dominant language
- Java
- Stars
- 15.3k
- Forks
- 3.8k
- Avg merge
- 1d 14h
- Merged PRs (30d)
- 160
Description
### Search before asking
- [X] I searched in the [issues](https://github.com/apache/pulsar/issues) and found nothing similar.
### Version
pulsar-2.10.1 runs on the k8s cluster.
### Minimal reproduce step
## Precondition
There is only one topic under this namespace.
Topic: `persistent://kafka_test/test/my_test_par_10`
Partition Num: 10
Broker Num: 3
Bookie Num: 4
Broker Metrics: `pulsar_throughput_in`, `pulsar_throughput_out`
### Producer
`bin/pulsar-perf produce --batch-max-messages 30000 --num-producers 2 --num-test-threads 2 --num-io-threads 2 --rate 30000 --size 1000 persistent://kafka_test/test/my_test_par_10`
### Consumer
`bin/pulsar-perf consume persistent://kafka_test/test/my_test_par_10 -ss sub201`
## Dispatch Rate Test
Please refer to [PIP-3](https://github.com/apache/pulsar/wiki/PIP-3:-Message-dispatch-throttling)
We test the byte and message dispatch rates separately. The test results are not excepted(Not exact).
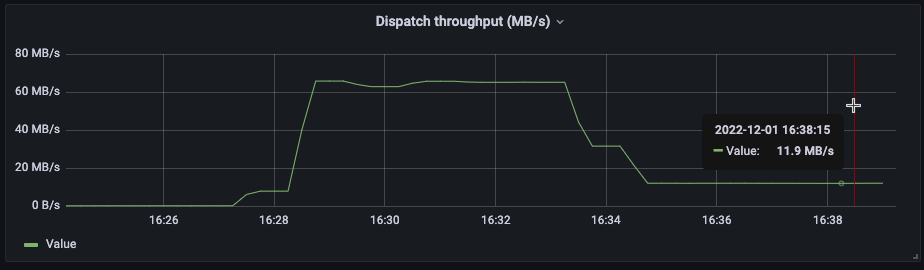
### Byte Dispatch Rate
Only set the byte dispatch rate = 1000000(1MB). The excepted result is 1MB/s. However, the test result is 11.9MB/s.(Ref to broker metric `pulsar_throughput_out `)
`bin/pulsar-admin namespaces set-dispatch-rate kafka_test/test --byte-dispatch-rate 1000000 --dispatch-rate-period 1`
### Message Dispatch Rate
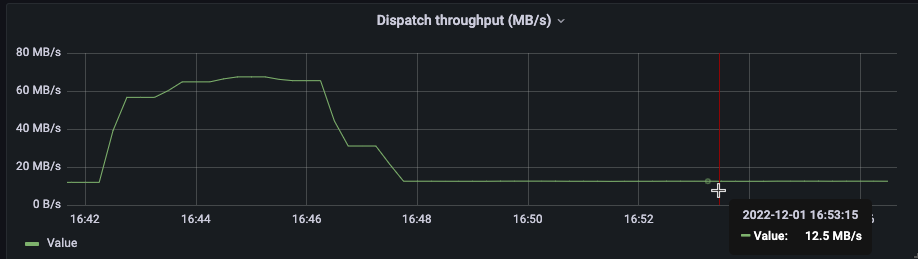
Only set the message dispatch rate = 1000. The excepted result is 1MB/s. However, the test result is 12.5MB/s.(Ref to broker metric `pulsar_throughput_out `)
`bin/pulsar-admin namespaces set-dispatch-rate kafka_test/test --msg-dispatch-rate 1000 --dispatch-rate-period 1`
## Publish Rate Test
We test the byte and message publish rates separately. The test results are not excepted.
### Byte Publish Rate
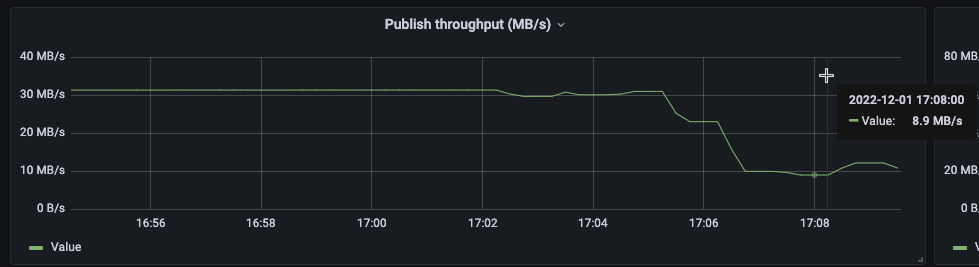
Only set the byte publish rate = 1000000(1MB). The excepted result is 1MB/s. However, the test result is 8.9MB/s.(Ref to broker metric `pulsar_throughput_in `)
`bin/pulsar-admin namespaces set-publish-rate kafka_test/test --byte-publish-rate 1000000`
### Message Publish Rate
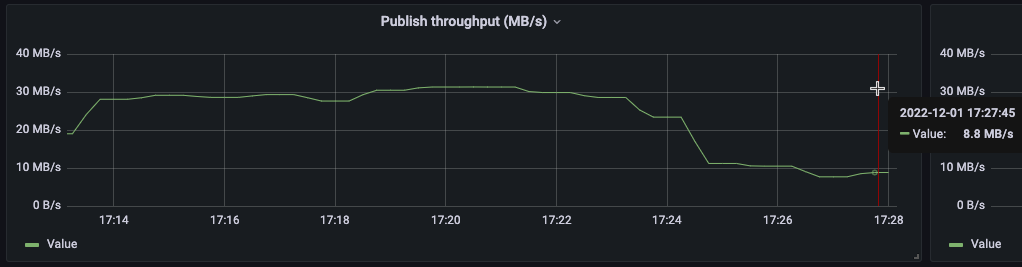
Only set the message publish rate = 1000. The excepted result is 1MB/s. However, the test result is 8.8MB/s.(Ref to broker metric `pulsar_throughput_in `)
`bin/pulsar-admin namespaces set-publish-rate kafka_test/test --msg-publish-rate 1000`
## Resource Group
Please refer to [PIP-82](https://github.com/apache/pulsar/wiki/PIP-82:-Tenant-and-namespace-level-rate-limiting)
I tested both publish rate and dispatch rate in resourcegroup. However, the test results show the sourcegroup throttling does not work exactly.
## Publish Rate
### Message Publish Rate
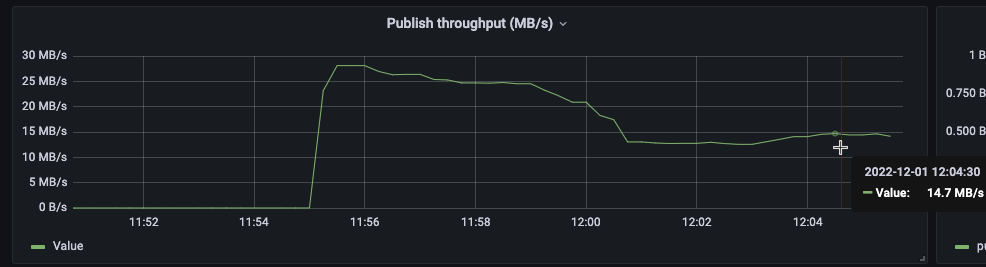
Only set the message publish rate = 100. One message size = 1024. The excepted result is 100KB/s. However, the result is 14.7MB/s.
```
bin/pulsar-admin resourcegroups create rs_name --msg-publish-rate 100
bin/pulsar-admin namespaces set-resource-group kafka_test/test --resource-group-name rs_name
```
### Byte Publish Rate
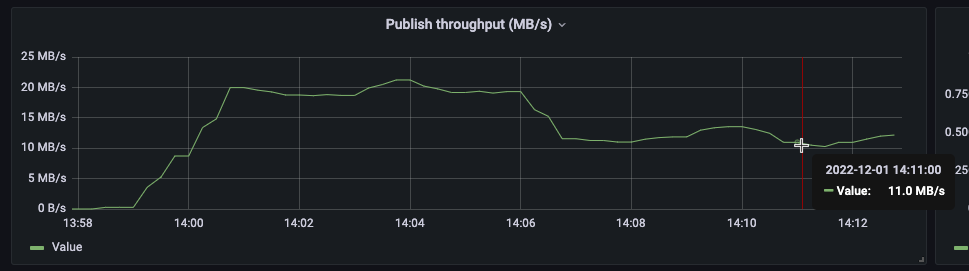
Only set the byte publish rate = 10000(1MB). One message size = 1024. The excepted result is 10KB/s. However, the result is 11MB/s.
```
bin/pulsar-admin resourcegroups create rs_name --byte-publish-rate 10000
```
## Dispatch Rate
### Byte Dispatch Rate
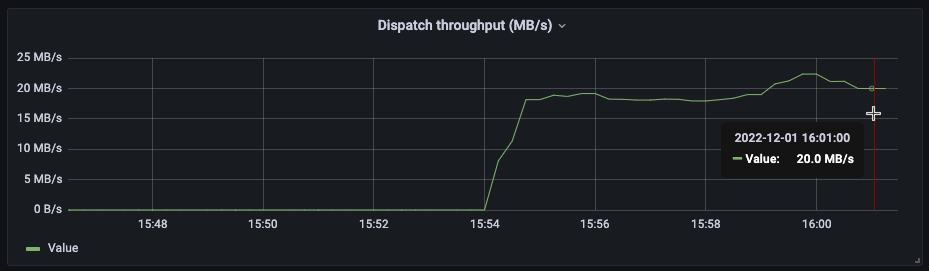
Only set the byte dispatch rate = 1000(1MB). One message size = 1024. The excepted result is 10KB/s. However, the result is 20MB/s.
```
bin/pulsar-admin resourcegroups create rs_name --byte-dispatch-rate 10000
```
### Message Dispatch Rate
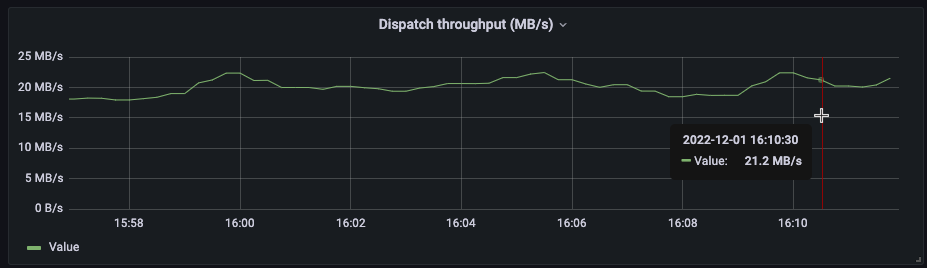
Only set the message dispatch rate = 100. One message size = 1024. The excepted result is 100KB/s. However, the result is 21.2MB/s.
```
bin/pulsar-admin resourcegroups create rs_name --msg-dispatch-rate 100
```
### What did you expect to see?
I provide the excepted value in the above reproduction steps.
### What did you see instead?
Please refer to the reproduction steps.
### Anything else?
_No response_
### Are you willing to submit a PR?
- [ ] I'm willing to submit a PR!
Contributor guide
Research direction
Start by reproducing the issue with the provided pulsar-perf producer and consumer commands, then apply the namespace and resource-group limits through the listed pulsar-admin commands. Compare broker metrics with the configured byte and message limits; done means publish and dispatch throughput is close to the expected values rather than several times higher.
Written by the indexing model from the issue text.
Assessment
- Tech stack
- java
- Domain
- distributed-systems
- Issue type
- Bug
- Difficulty
- 4/5
- Estimated time
- 3-5 days
- Activity status
- Stale
- Clarity
- Needs clarification
- Newbie friendliness
- 30/100