The topic monitoring information is incorrect
- Dominant language
- Java
- Stars
- 15.3k
- Forks
- 3.8k
- Avg merge
- 1d 14h
- Merged PRs (30d)
- 160
Description
**Describe the bug**
In the Grafana control panel, my topic number is in the tens of millions, but the actual cluster is in the tens of thousands. Other indicators are also incorrect, such as pulsar_topicS_count, pulsar_producers_count, pulsar_consumerS_count, etc
and I also get inaccurate data from calling broker metrics
curl -sL http://xxxxx:8721/metrics | grep pulsar_topics_count
pulsar_topics_count{cluster="cluster-bj",namespace="2000001486-serverless-image/thumb"} 1707 1641971581495
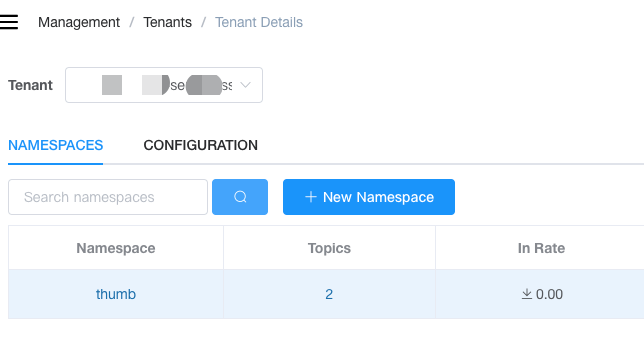
Normally, the topic of this namespace is 2 , such as image-2
**Screenshots**
image-1
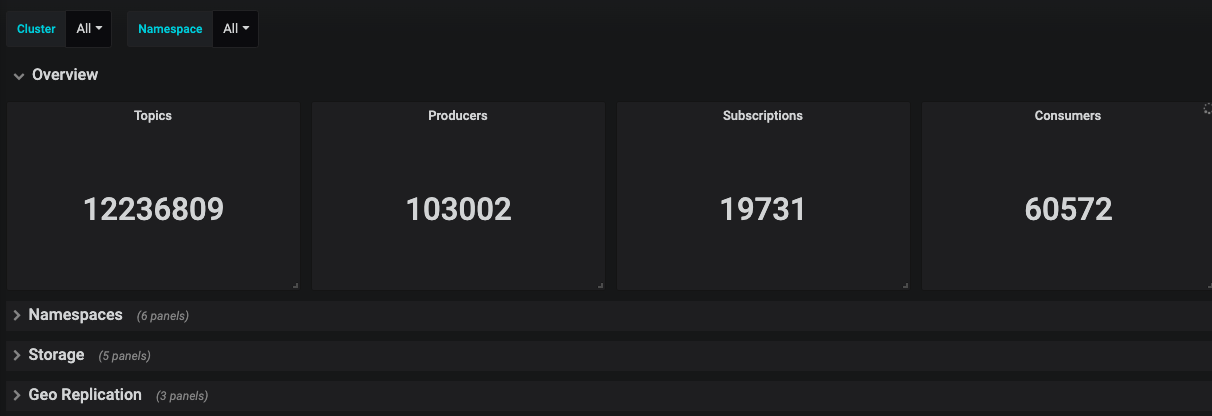
image-2
Contributor guide
Research direction
Start by reproducing the reported discrepancy with the issue’s `curl -sL http://xxxxx:8721/metrics | grep pulsar_topics_count` command and comparing it with the topic count shown in Grafana. Check the broker metrics for the reported namespace and related producer and consumer counts; done means the metrics match the actual cluster counts.
Written by the indexing model from the issue text.
Assessment
- Tech stack
- grafana, java
- Domain
- observability
- Issue type
- Bug
- Difficulty
- 4/5
- Estimated time
- 3-5 days
- Activity status
- Stale
- Clarity
- Mostly clear
- Newbie friendliness
- 25/100