Grafana dashboard warm/non-warm container metrics not working
- Dominant language
- Scala
- Stars
- 6.8k
- Forks
- 1.2k
- Avg merge
- 2d 14h
- Merged PRs (30d)
- 2
Description
## Environment details:
* Kubernetes deployment
* Docker version 19.03.6, Ubuntu 18.04.4 LTS 4.15.0-1065-aws
## Steps to reproduce the issue:
1. deploy OW on Kubernetes using https://github.com/apache/openwhisk-deploy-kube.git
2. connect to dashboard at https://apihost/monitoring/dashboards
3. check out Action Performance Metrics
## Provide the expected results and outputs:
```
Warm/non-warm container starts show the correct numbers.
```
## Provide the actual results and outputs:
```
Warm/non-warm container starts figures show random lines, and constantly changing:
```
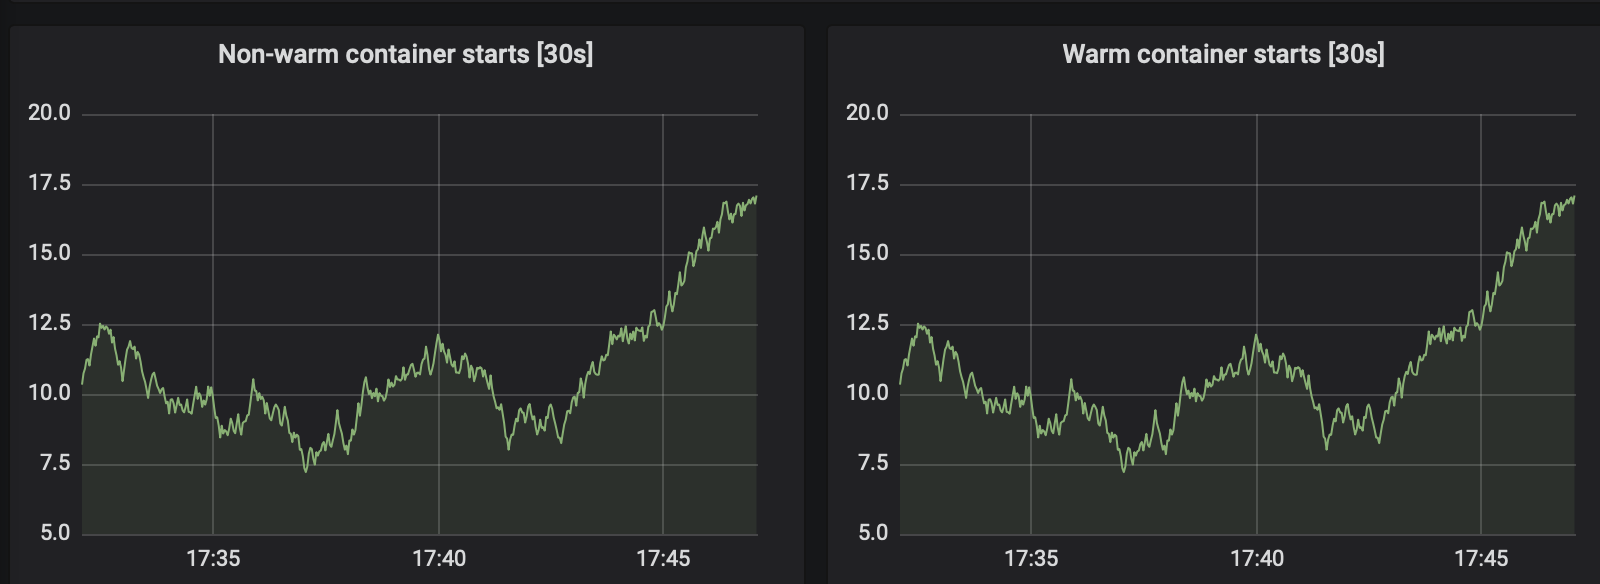
## Additional information you deem important:
* seems this statement is not evaluated correctly https://github.com/apache/openwhisk/blob/master/core/monitoring/user-events/compose/grafana/dashboards/openwhisk_events.json#L1559
Contributor guide
Assessment
This issue has not been assessed yet.