Flame Graph support in Profiler
- Dominant language
- Java
- Stars
- 3.1k
- Forks
- 935
- Avg merge
- 2d 3h
- Merged PRs (30d)
- 17
Description
### Description
When investigating a profiling run you need to drill down through a lot of nested method calls to see details because there are so much data.
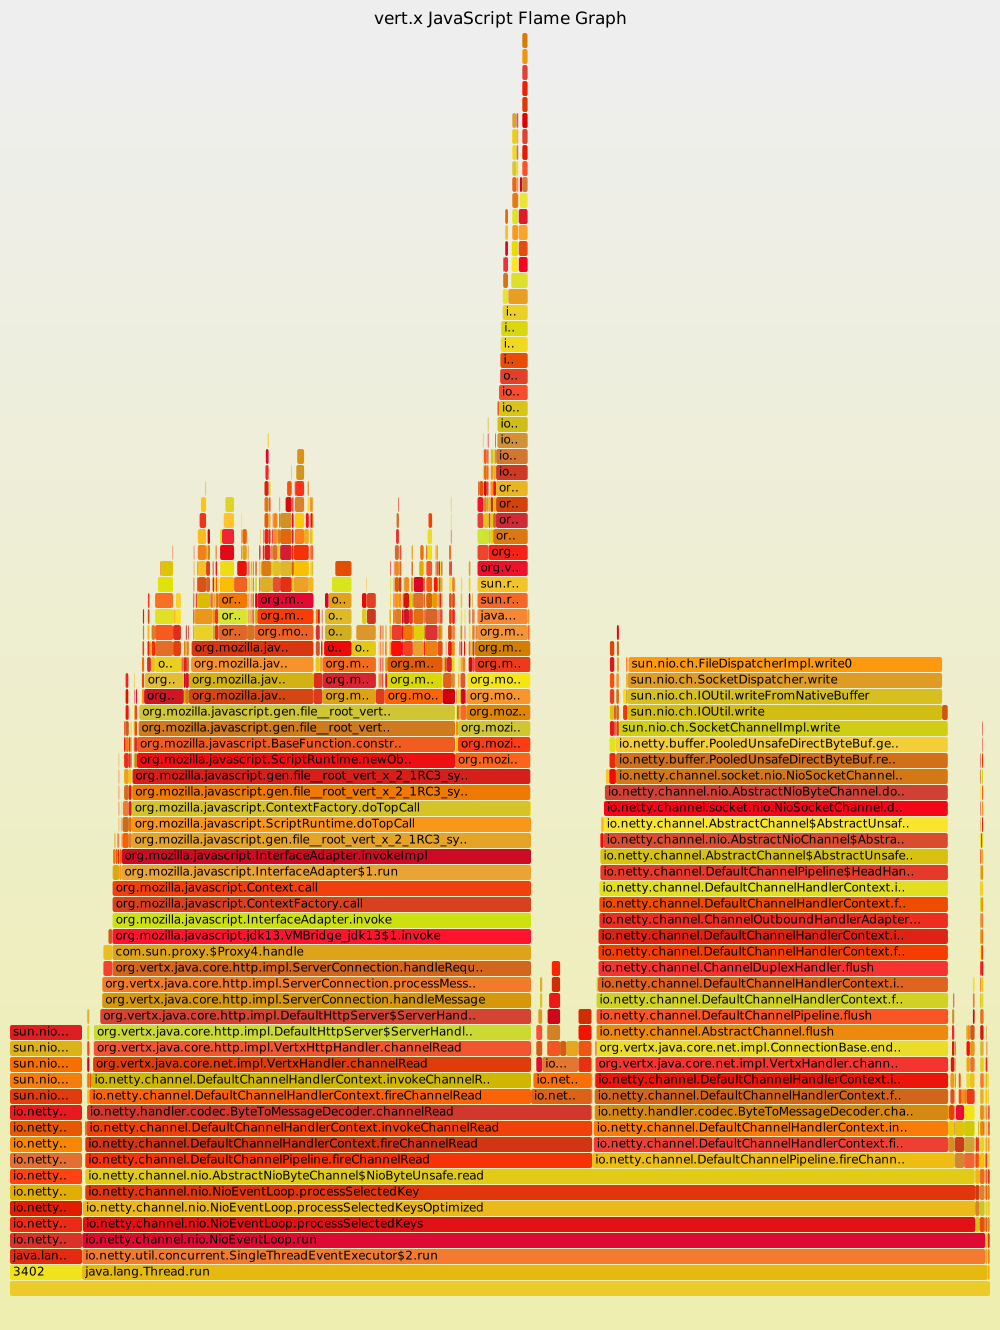
It would be nice to be able to generate a flame graph similar to what is shown in https://www.brendangregg.com/blog/2014-06-12/java-flame-graphs.html from the profiler tab. Just generate the SVG on disk without any further integration would be very helpful during investigation.
Actual sample from above link (note hovers do not work in issue presentation, open SVG to see hovers)
### Use case/motivation
The idea is to get better visualization of data, by presenting more in the same space. Flame Graphs have proven their worth for presenting profile data and would in my opinion be a very useful addition to the Netbeans Profiler.
### Related issues
_No response_
### Are you willing to submit a PR?
- [X] Yes I am willing to submit a PR!
### Code of Conduct
- [X] I agree to follow the Apache Software Foundation's [Code of Conduct](https://www.apache.org/foundation/policies/conduct.html)
Contributor guide
Research direction
Start in the NetBeans Profiler tab and trace how a profiling run's data is currently presented. Define how the requested flame graph should be generated as an SVG on disk, including the profile data and visualization behavior, then validate the result against the linked Brendan Gregg example.
Written by the indexing model from the issue text.
Assessment
- Tech stack
- java
- Domain
- devtools, performance
- Issue type
- Feature
- Difficulty
- 5/5
- Estimated time
- Over a week
- Activity status
- Stale
- Clarity
- Needs clarification
- Newbie friendliness
- 30/100