How report dashboard aggregate multiple variables in one custom graph
- Dominant language
- Java
- Stars
- 9.5k
- Forks
- 2.3k
- Avg merge
- 1d 22h
- Merged PRs (30d)
- 5
Description
### The documentation URL
https://jmeter.apache.org/usermanual/generating-dashboard.html#customs_graphs
### Feedback
The jmeter report dashboard has provided user with customizing the graph with one variable by the following code in user.properties file.
`jmeter.reportgenerator.graph.custom_testGraph.classname=org.apache.jmeter.report.processor.graph.impl.CustomGraphConsumer
jmeter.reportgenerator.graph.custom_testGraph.title=Chunk Hit
jmeter.reportgenerator.graph.custom_testGraph.property.set_Y_Axis=Number of Hits
jmeter.reportgenerator.graph.custom_testGraph.set_X_Axis=Over Time
jmeter.reportgenerator.graph.custom_testGraph.property.set_granularity=60000
jmeter.reportgenerator.graph.custom_testGraph.property.set_Sample_Variable_Name=ts-hit
jmeter.reportgenerator.graph.custom_testGraph.property.set_Content_Message=Number of Hits
`
Only one parameter in one graph couldn't meet requirement.
When I tried to set multiple sample vaiable name , it failed by no column definition.
jmeter.reportgenerator.graph.custom_testGraph.property.set_Sample_Variable_Name=t**s-hit,ts-hit2,ts-hit3**
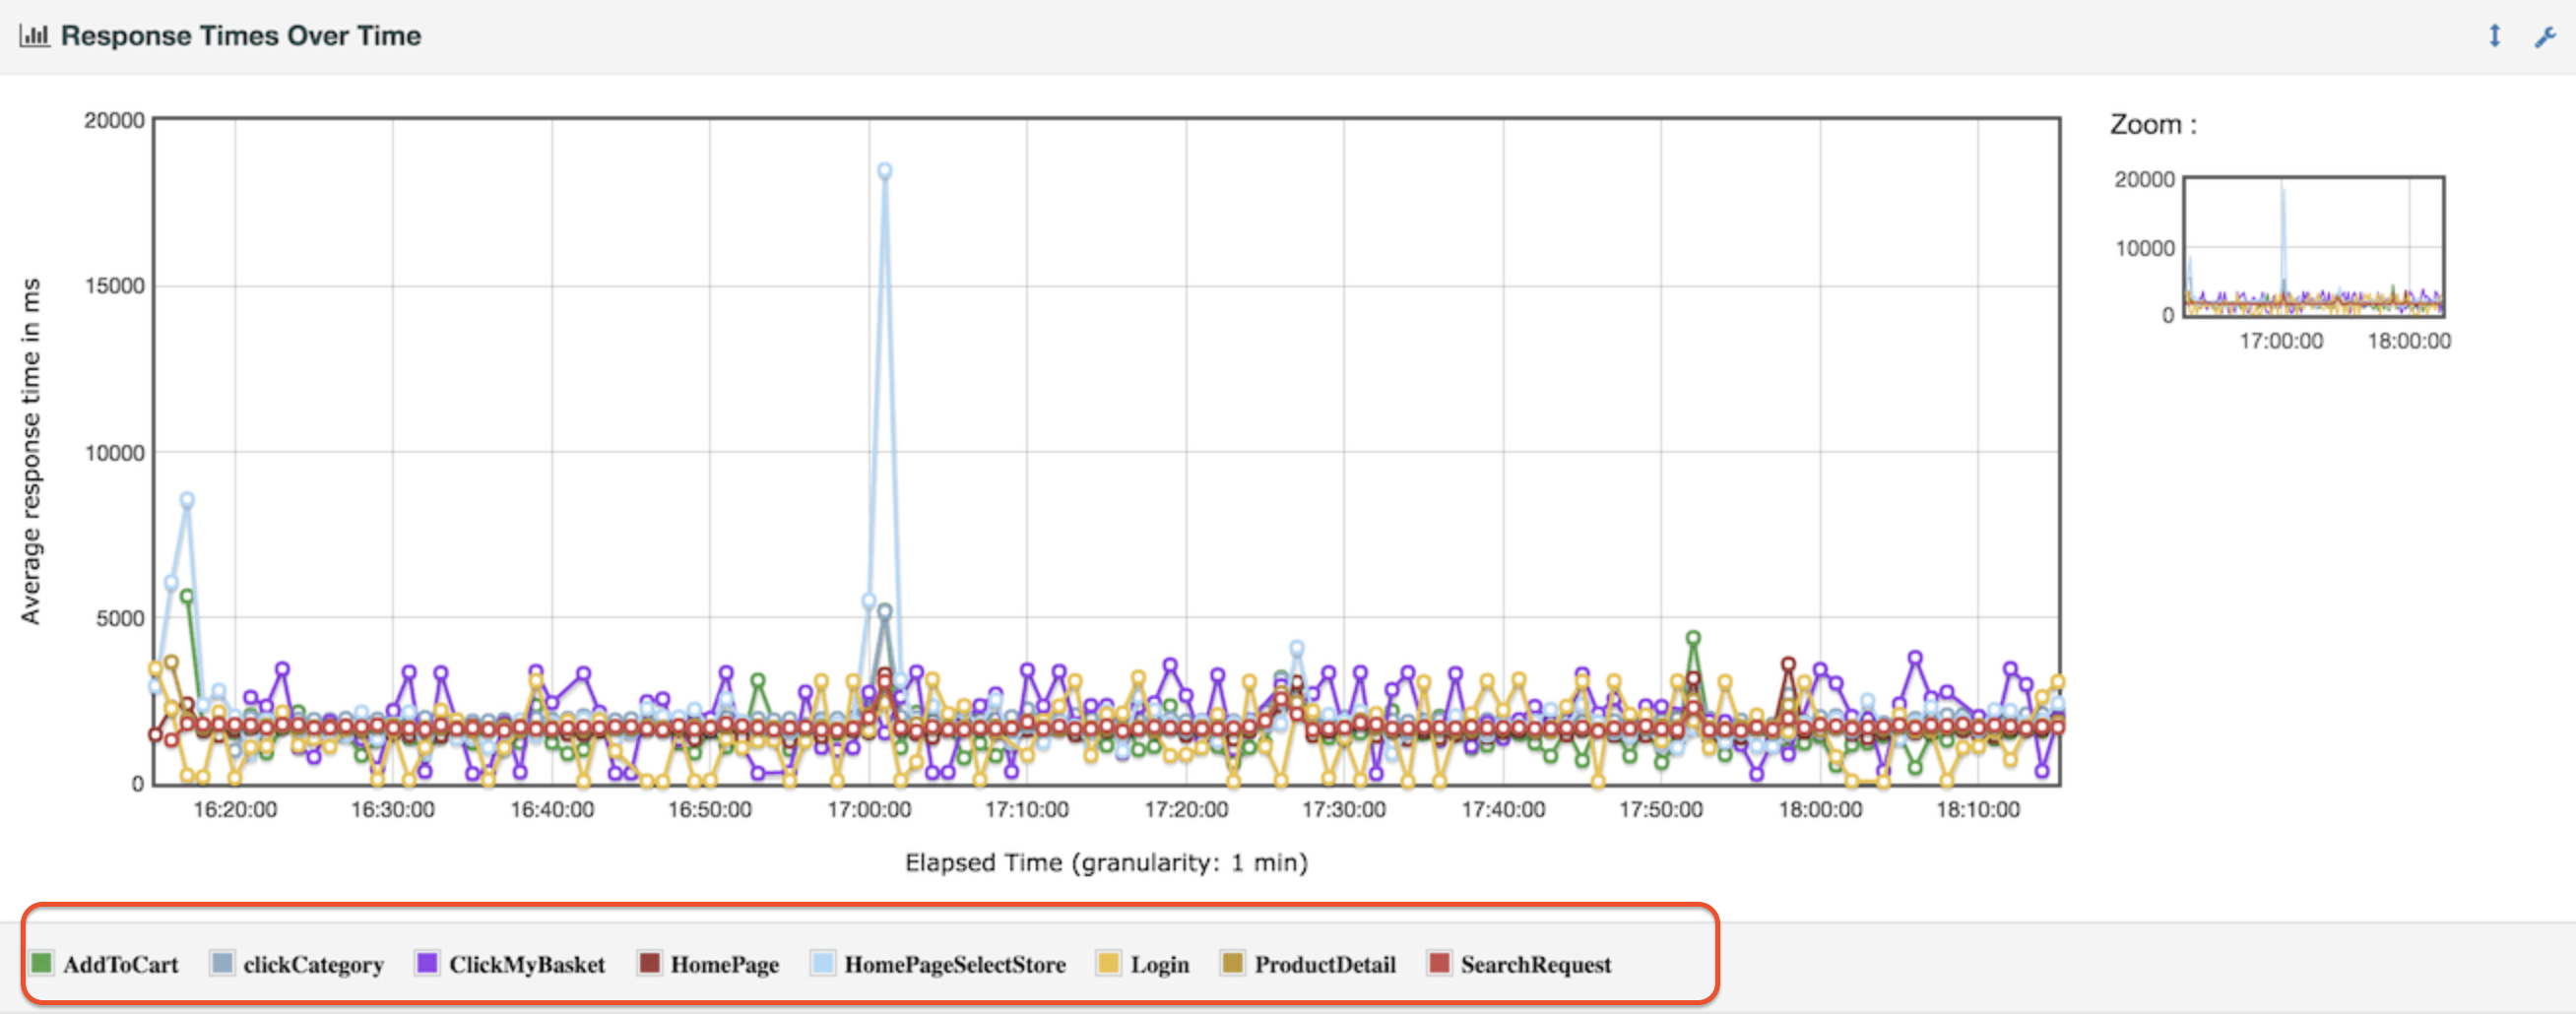
How does jmeter define custom graph like "Response times Over Time" which support multiple variables () display and selection.
Contributor guide
Assessment
This issue has not been assessed yet.