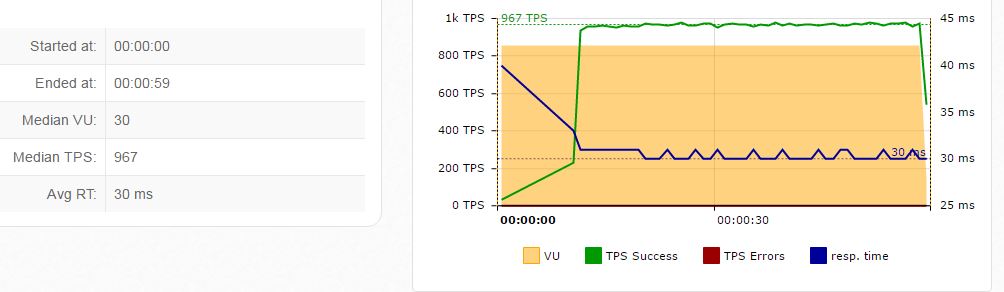
Add a TPS and Latency combination grap to the dashboard
- Dominant language
- Java
- Stars
- 9.5k
- Forks
- 2.3k
- Avg merge
- 1d 22h
- Merged PRs (30d)
- 5
Description
**Anthony Kearns** ([Bug 60204](https://bz.apache.org/bugzilla//show_bug.cgi?id=60204&redirect=false)):
When I prepair metrics for our performance results I like to combine the two metrics which my management can relate to and understand e.g. TPS (Transactions per second) and Latency.
I would like to see a combination grap for latency, transactions per second and VU's (virtual users).
Please see an example graph attached....
Created attachment [TPS vs Latency vs Virtual Users.JPG](https://apache.github.io/jmeter-bugzilla-attachments/04/60204/34328/TPS%20vs%20Latency%20vs%20Virtual%20Users.JPG): proposed graph for Latency vs TPS vs Virtual Users
Votes in Bugzilla: 1
OS: All
Contributor guide
Research direction
Start by locating the dashboard entry points that assemble TPS, latency, and virtual-user metrics, then inspect how existing charts are generated. Done means the dashboard presents a combined TPS-versus-latency graph with VUs represented as requested in the attached example.
Written by the indexing model from the issue text.
Assessment
- Tech stack
- java
- Domain
- data-visualization
- Issue type
- Feature
- Difficulty
- 4/5
- Estimated time
- 3-5 days
- Activity status
- Stale
- Clarity
- Mostly clear
- Newbie friendliness
- 35/100