[SUPPORT] Disproportionately Slow performance during "Building workload profile" phase
- Dominant language
- Java
- Stars
- 6.2k
- Forks
- 2.5k
- Avg merge
- 2d 8h
- Merged PRs (30d)
- 111
Description
**_Tips before filing an issue_**
- Have you gone through our [FAQs](https://hudi.apache.org/learn/faq/)?
- Join the mailing list to engage in conversations and get faster support at dev-subscribe@hudi.apache.org.
- If you have triaged this as a bug, then file an [issue](https://issues.apache.org/jira/projects/HUDI/issues) directly.
**Describe the problem you faced**
From time to time (~ 1 in 8-20 Glue Job runs) we will have a glue job that takes between 2x and 5x longer than the nominal glue job duration for the workload in question. Analysing the Spark UI logs, we see a very long `Building workload profile` job.
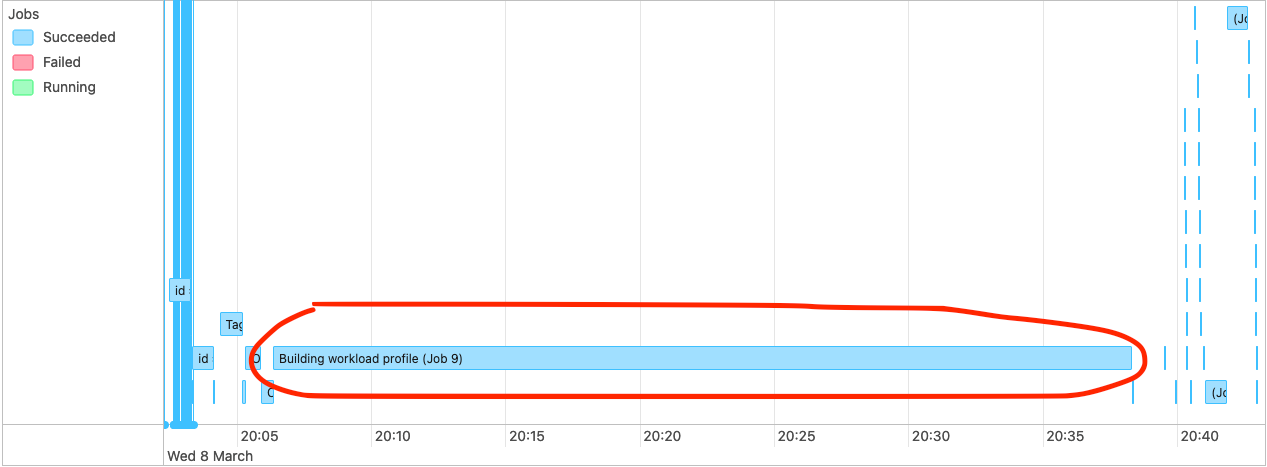
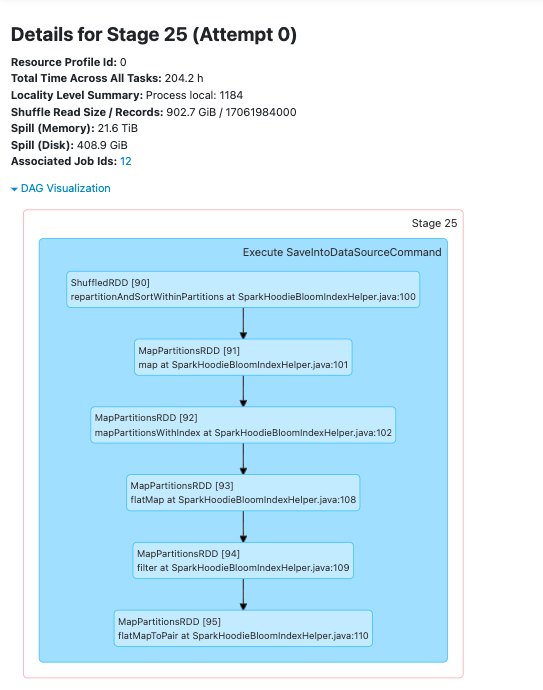
Drilling into that job we see that the longest task in that job always resolves to the following stack trace:
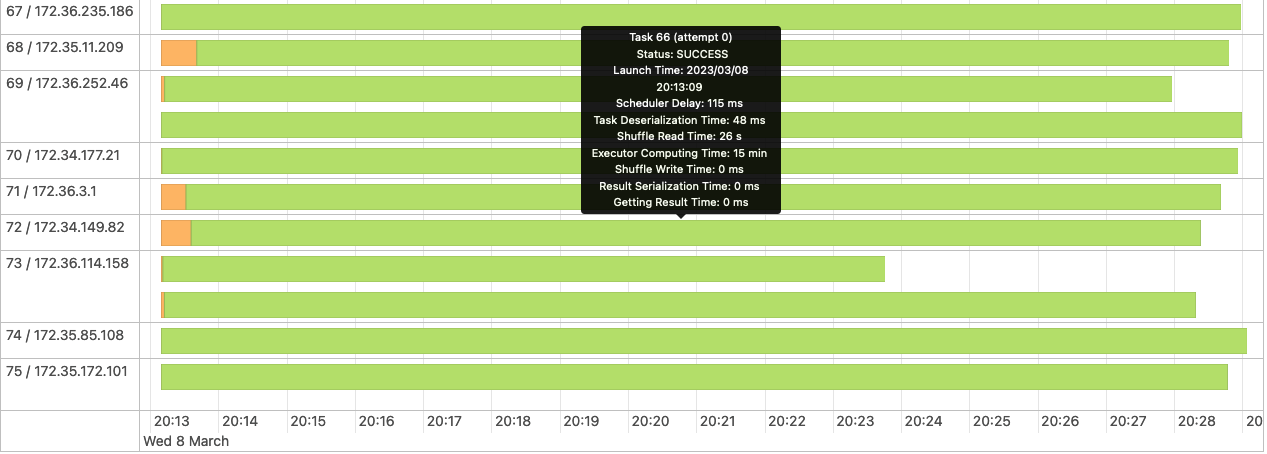
We also see quite high shuffling relative to the overall dataset size in this job when we have these slow glue jobs, although not much of the actual time spent is categorised as shuffling.
My understanding is that this code is trying to determine which files must be written to, and because we use a bloom index it does this by interrogating the bloom indices in the partition, and then checking candidate files. We are using bucketized checking.
I analyzed s3 access logs during these `Building workload profile` jobs, looking at the number of accesses to files and found that in the slow jobs files are typically accessed many more times, form more remote ip addresses than in the fast jobs. This particular hudi table is produced for a performance test and is never queried, so I am confident that s3 access during this period is only due to this hudi job.
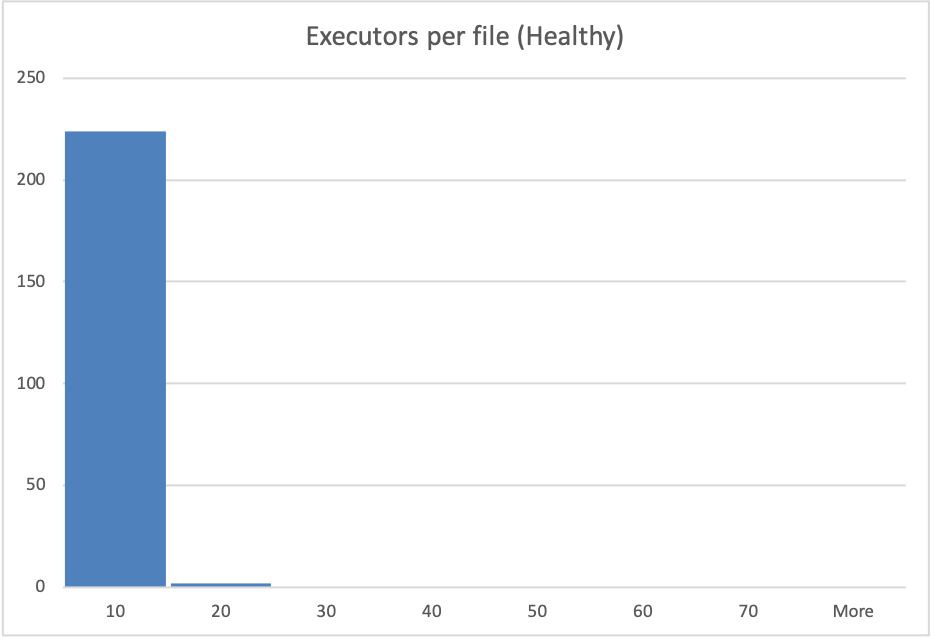
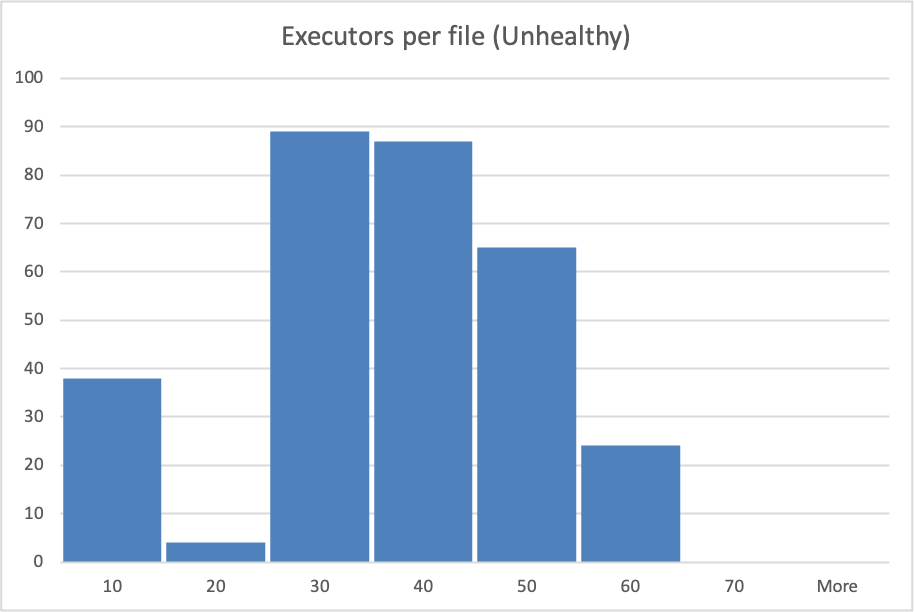
NB: the histogram buckets are coarse, in the healthy case the "10" bucket is predominantly a value of 4 executors per file.
See the repro steps below for how the dataset is produced, but as far as I can tell, the only real difference from one glue job run to the next is the ordering of records in the kinesis streams that feed the glue job.
**To Reproduce**
Steps to reproduce the behavior:
Our data-flow is roughly Lambda -> Kinesis Stream -> Periodic Glue Job -> S3
Over a 2 hour period we generate inputs to the Lambdas that result in ~3.5B records in the datalake. This data is distributed across 14 partitions, with a gaussian-like distribution, such that "Partition 0" (which has no data at the start of the 2 hour period) gets ~90% of the records and Partition 13 gets 0.05% of the records. Partitions 1-13 are from previous runs of the test and so each have ~3-3.5B records in them already.
Record keys are structured such that they sort with time (the first field in the record key is an epochMillis timestamp), thus records in the same partition should be sortable into an approximately monotonically increasing order.
A typical run of the Glue job will handle ~8-10% of the data at a time, but because of the way the data is created each batch processed by Glue has roughly the same distribution.
Approximately 1 in 15 Glue Job runs will result in a very long `Building workload profile` job within spark.
**Expected behavior**
Given relatively consistent quantities of data, distribution of data across partitions and partition sizes we would expect relatively consistent Glue Job run durations.
**Environment Description**
* Hudi version : 0.11.0
* Spark version : 3.1.2
* Hive version : 2.3.1
* Hadoop version : 2.7 I think? We're using the hudi 0.11 spark 3.1.x bundle, on AWS Glue 3.
* Storage (HDFS/S3/GCS..) : S3
* Running on Docker? (yes/no) : No
**Additional context**
Add any other context about the problem here.
**Stacktrace**
```Add the stacktrace of the error.```
Not an error per-se. Stack trace is in screenshot above.
Contributor guide
No contributing guide indexed for this repository
Research direction
Start with the Spark UI's “Building workload profile” job and the Hudi bloom-index bucketized-checking path described in the report. Reproduce the Glue job with the stated partition distribution, then compare slow and fast runs using Spark UI details and S3 access logs; done means identifying a consistent cause or actionable failure pattern.
Written by the indexing model from the issue text.
Assessment
- Tech stack
- aws, java, spark
- Domain
- data-engineering, performance, stream-processing
- Issue type
- Bug
- Difficulty
- 4/5
- Estimated time
- 3-5 days
- Activity status
- Quiet
- Clarity
- Needs clarification
- Newbie friendliness
- 35/100