[Feature Request]: Workflow and Pipeline Orchestration Visual Flow Graph
- Dominant language
- Java
- Stars
- 1.5k
- Forks
- 476
- Avg merge
- 18h 33m
- Merged PRs (30d)
- 204
Description
### What would you like to happen?
Yesterday I got to see a different data orchestration product that had a killer interactive visualization of workflow and pipeline execution. I wish Hop would render something like this. It would help users understand the stages and flows involved in how they designed data movement. The same visualization approach would work for data lineage as well.
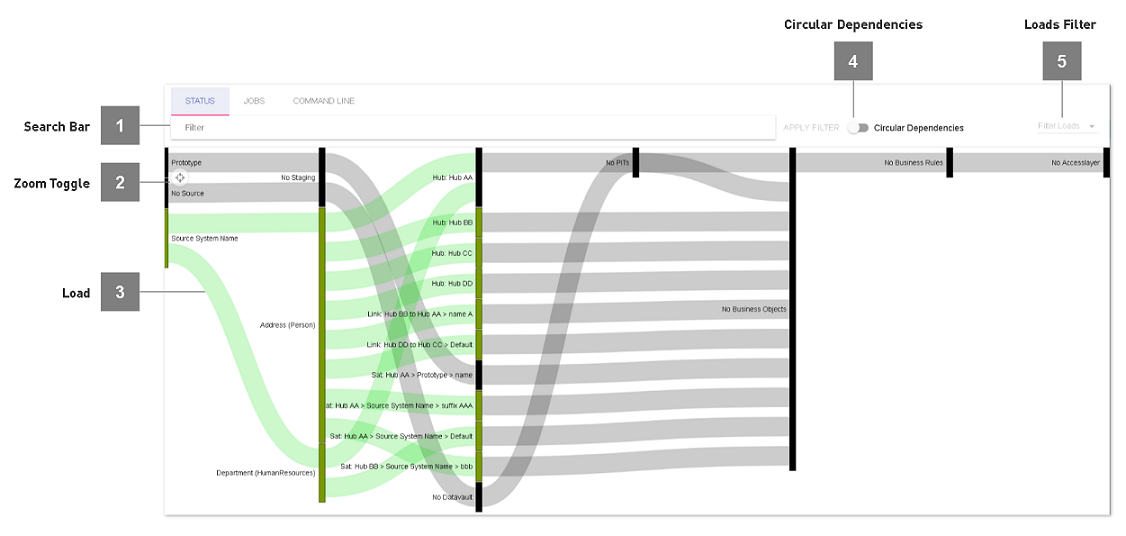
It was brilliantly done. The best compliment is copying.
https://datavault-builder.com/wp-content/uploads/documentation-portal/latest_6/_modules/operations.html
### Issue Priority
Priority: 3
### Issue Component
Component: Hop Gui
Contributor guide
Research direction
Start by reviewing the Hop Gui area and the issue's referenced example of workflow and pipeline execution visualization. Done would mean an interactive visual flow graph for workflow or pipeline stages and flows, with the same approach considered for data lineage.
Written by the indexing model from the issue text.
Assessment
- Tech stack
- java
- Domain
- data-visualization, frontend
- Issue type
- Feature
- Difficulty
- 5/5
- Estimated time
- Over a week
- Activity status
- Stale
- Clarity
- Needs clarification
- Newbie friendliness
- 20/100