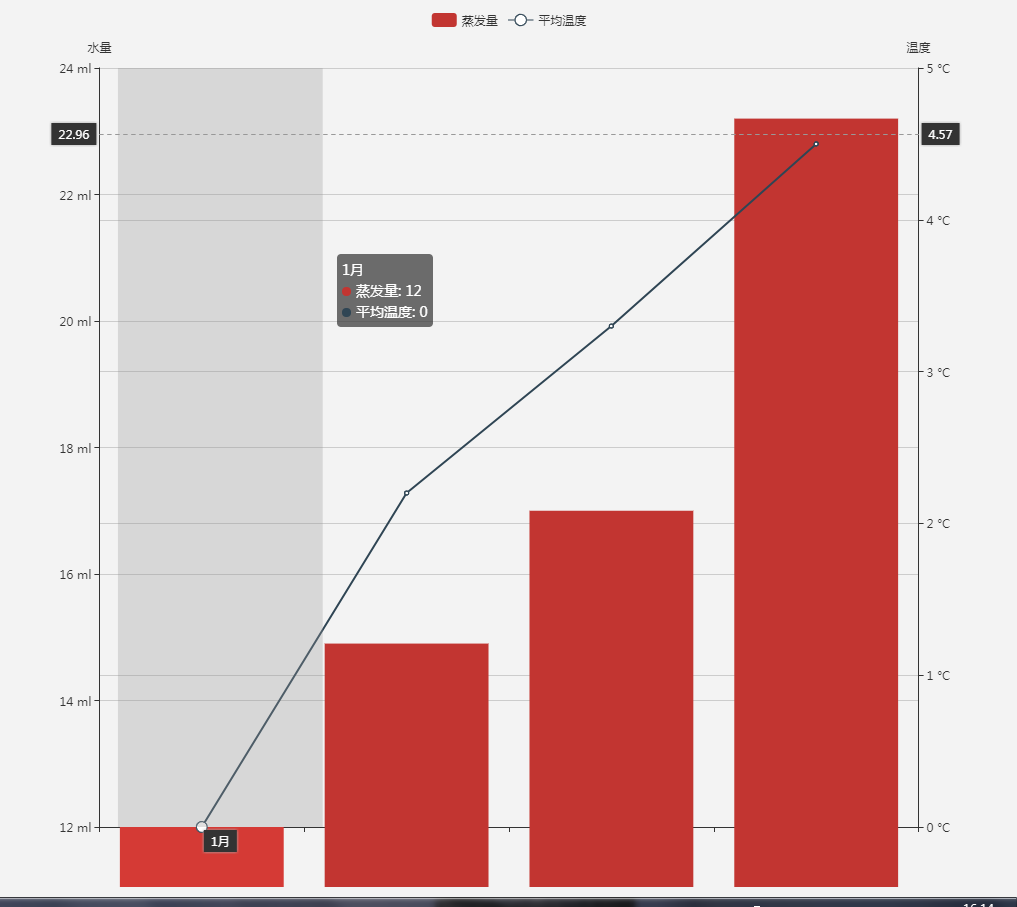
双Y坐标轴,设置scale: "true" ,特定数据下,显示效果图异常
- Dominant language
- TypeScript
- Stars
- 67.3k
- Forks
- 19.8k
- Avg merge
- 11d 14h
- Merged PRs (30d)
- 8
Description
### One-line summary [问题简述]
如果左Y轴的数据和右Y轴的坐标都包含0刻度或者都不包含0刻度,效果正常
如果有一方的坐标包含0刻度 而另一方不包含0刻度且该Y轴的series的type是bar且该Y轴设置了scale: "true" ,在某些特定的数据下效果就不正常了
该问题在3.6及其以下是没有出现的
### Version & Environment [版本及环境]
+ ECharts version [ECharts 版本]: 3.7.2/3.8.4
+ Browser version [浏览器类型和版本]: chrome版本 62.0.3202.94(正式版本)
+ OS Version [操作系统类型和版本]: Windows 7 专业版
### Expected behaviour [期望结果]
### ECharts option [ECharts配置项]
```javascript
option = {
tooltip: {
trigger: 'axis',
axisPointer: {
type: 'cross',
crossStyle: {
color: '#999'
}
}
},
legend: {
data:['蒸发量','降水量','平均温度']
},
xAxis: [
{
type: 'category',
data: ['1月','2月','3月','4月'],
axisPointer: {
type: 'shadow'
}
}
],
yAxis: [
{
scale: "true" ,
type: 'value',
name: '水量',
axisLabel: {
formatter: '{value} ml'
}
},
{
scale: "true" ,
type: 'value',
name: '温度',
axisLabel: {
formatter: '{value} °C'
}
}
],
series: [
{
name:'蒸发量',
type:'bar',
data:[12.0, 14.9, 17.0, 23.2]
},
{
name:'平均温度',
type:'line',
yAxisIndex: 1,
data:[0, 2.2, 3.3, 4.5]
}
]
}
```
### Other comments [其他信息]
Contributor guide
Assessment
This issue has not been assessed yet.