[Feature] dataZoom.filterMode - should be controllable individually by series OR behave different
- Dominant language
- TypeScript
- Stars
- 67.3k
- Forks
- 19.8k
- Avg merge
- 11d 14h
- Merged PRs (30d)
- 8
Description
### What problem does this feature solve?
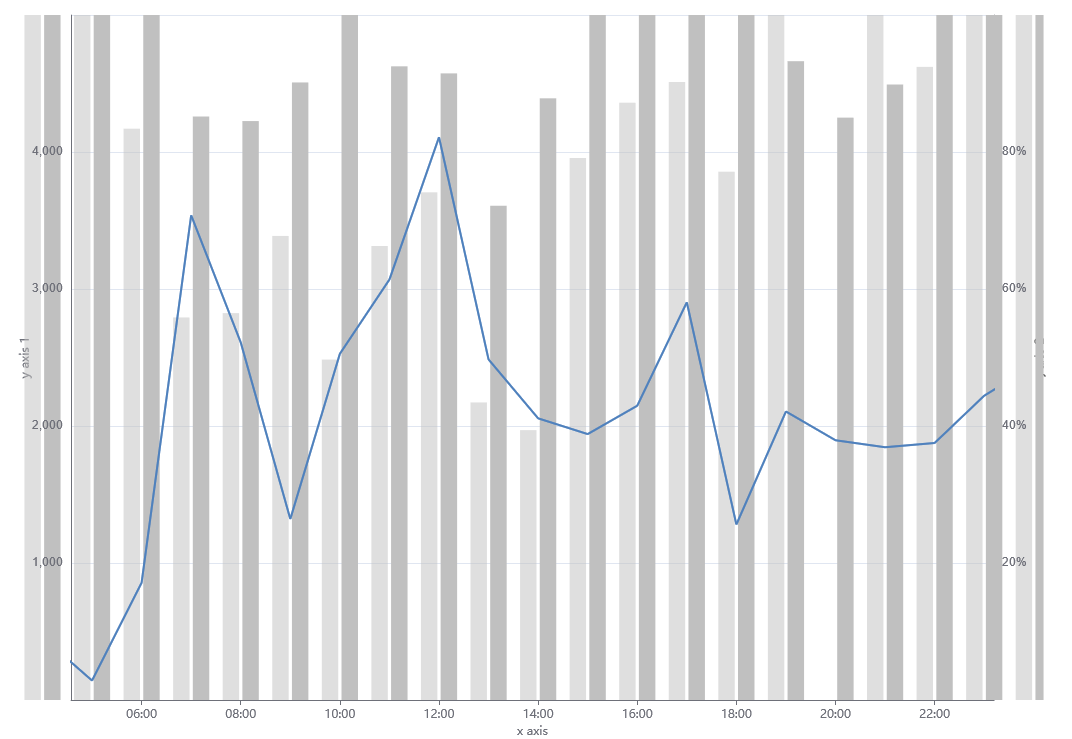
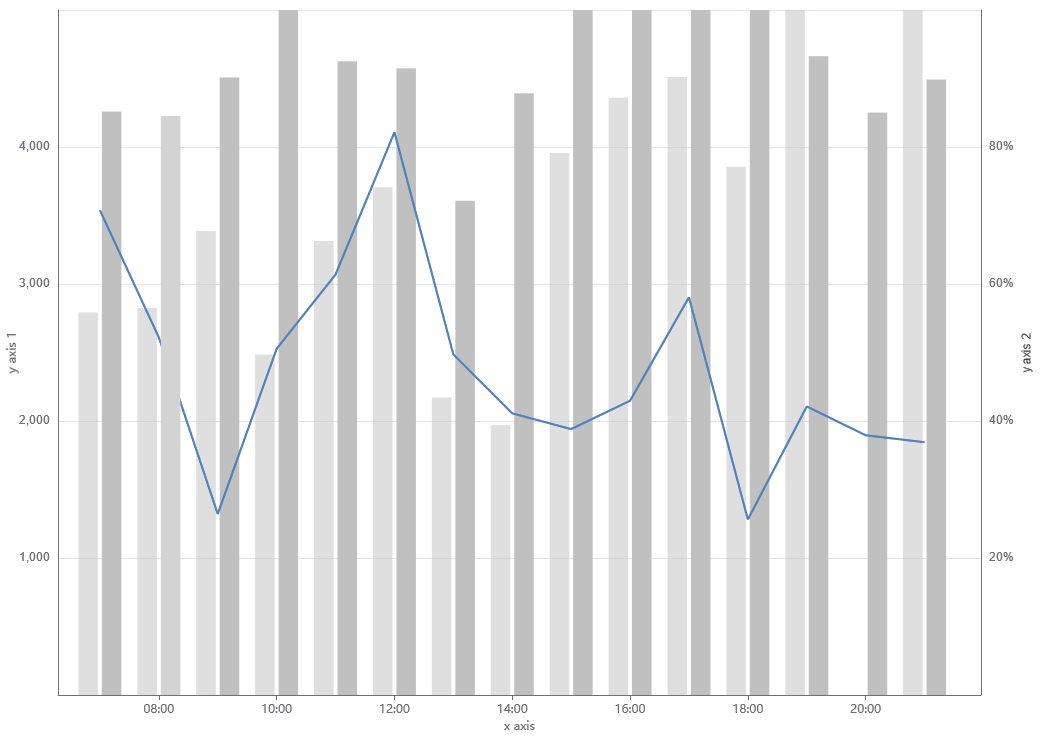
As seen in #17631, with the current options it is not possible to achieve a chart where bars outside the axes are clipped, but lines are still drawn to the axes. Currently, only filterMode="none" allows lines to be drawn up to the axes even if the next datapoint is out of the axis limits. At the same time, "none" will allow bars to be displayed outside the chart area (see screenshots below). I also think the current behaviour is somewhat inconsistent because bars are able to show outside the axis limits, but line segments are indeed clipped when reaching the axes.
### What does the proposed API look like?
I'd either propose a new filterMode (e.g. "chartArea") which simply does clip anything that visually lies outside the axis bounds (I guess that is what most users would expect anyway), or the ability to set the filterMode per series.
Contributor guide
Assessment
This issue has not been assessed yet.