[Bug] Group Connect - Tooltip is not being triggered when graph contains series.lines with a few points also series.candlestick
- Dominant language
- TypeScript
- Stars
- 67.3k
- Forks
- 19.8k
- Avg merge
- 11d 14h
- Merged PRs (30d)
- 8
Description
### Version
5.3.2
### Link to Minimal Reproduction
https://codepen.io/gabrielkantox/pen/QWmNdQR
### Steps to Reproduce
```
var chart1 = echarts.init(document.getElementById("chart1"));
var option1 = {
title: {
text: "chart1"
},
tooltip: {
trigger: "axis"
},
legend: {
data: ["Forecast 1", "Forecast 2", "Forecast 3", "Forecast 4"]
},
xAxis: {
data: ["21-01-2022", "22-01-2022", "23-01-2022", "24-01-2022", "25-01-2022", "26-01-2022", "27-01-2022"]
},
yAxis: {},
series: [
{
name: "Rates",
type: "candlestick",
data: [[5.1,9,4,10], [3,8,2,9]],
},
{
name: "Forecast 1",
type: "line",
data: [["21-01-2022", 10], ["22-01-2022", null], ["23-01-2022", 20], ["24-01-2022", 13], ["25-01-2022", null], ["26-01-2022", null], ["27-01-2022", null]],
},
{
name: "Forecast 2",
type: "line",
data: [["26-01-2022", 14], ["27-01-2022", 16]],
},
{
name: "Forecast 3",
type: "line",
data: [["24-01-2022", 14], ["25-01-2022", 16]],
},
{
name: "Forecast 4",
type: "line",
data: [["21-01-2022", 2], ["22-01-2022", 4], ["23-01-2022", 6], ["24-01-2022", 12], ["25-01-2022", 24], ["26-01-2022", 26], ["27-01-2022", 30]],
},
]
};
var chart2 = echarts.init(document.getElementById("chart2"));
var option2 = {
title: {
text: "chart2"
},
tooltip: {
trigger: "axis"
},
legend: {
data: ["Forecast Total", "Forecast ENUM", "Orders"]
},
xAxis: {
data: ["21-01-2022", "22-01-2022", "23-01-2022", "24-01-2022", "25-01-2022", "26-01-2022", "27-01-2022"]
},
yAxis: [{}],
series: [
{
z: -1,
data: [["21-01-2022", 1], ["22-01-2022", 2], ["23-01-2022", 3], ["24-01-2022", 4], ["25-01-2022", 5], ["26-01-2022", 6], ["27-01-2022", 7]],
name: 'Orders',
type: 'line',
emphasis: {
disabled: true
},
coordinateSystem: 'cartesian2d',
areaStyle: {
color: "#CAF2FE"
},
symbol: 'circle',
showSymbol: false,
step: 'end',
color: '#CAF2FE',
},
{
name: "Forecast Total",
type: "line",
data: [["21-01-2022", 10], ["22-01-2022", 35], ["23-01-2022", 20], ["24-01-2022", 13], ["25-01-2022", 12], ["26-01-2022", 18], ["27-01-2022", 41]]
}
],
dataZoom: [
{ yAxisIndex: 0, filterMode: "none" }
]
};
chart1.setOption(option1);
chart2.setOption(option2);
chart1.group = "group1";
chart2.group = "group1";
echarts.connect("group1");
```
### Current Behavior
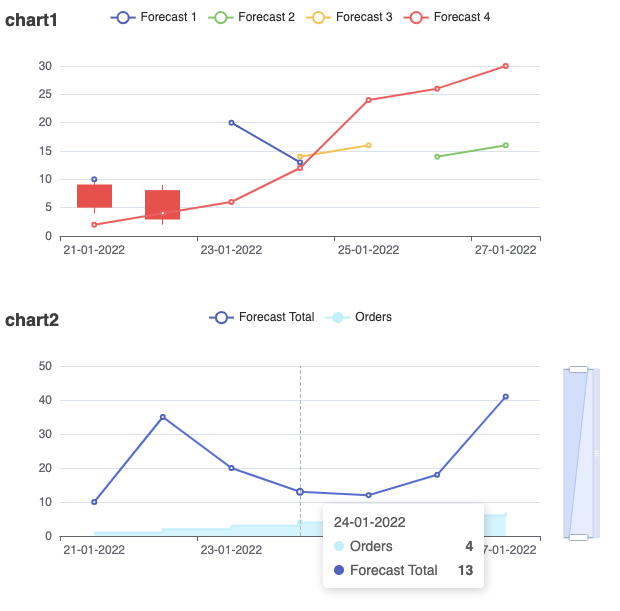
When the user mouse over the second chart it doesn't display the tooltip on the first:
The tooltip also gets lost (wrong position) in some cases
### Expected Behavior
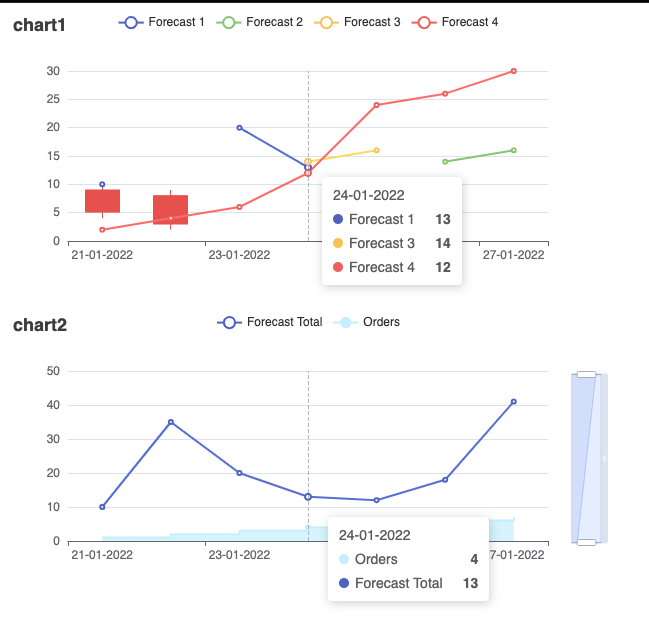
When the user mouse over a point on the second chart it should display the tooltip point on the first chart.
### Environment
```markdown
- OS: macOS Monterey
- Browser: Google Chrome Version 99.0.4844.74 (Official Build) (x86_64)
- Framework: EmberJS 3.28.8
```
### Any additional comments?
I removed line by line to see if I can figure out the issue but it happens in multiples cases.
1. With candlestick and series.line incomplete
2. With only series lines and 1 of them incomplete
Contributor guide
Assessment
This issue has not been assessed yet.