[Bug] dataZoom detail shape is not the same as data with value axis
- Dominant language
- TypeScript
- Stars
- 67.3k
- Forks
- 19.8k
- Avg merge
- 11d 14h
- Merged PRs (30d)
- 8
Description
### Version
5.2.2
### Link to Minimal Reproduction
https://echarts.apache.org/examples/zh/editor.html?c=line-simple&code=PYBwLglsB2AEC8sDeAoWsAeBBDEDOAXMmurGAJ4gCmRA5AG4CGANgK5W0kC-ANCeTnxFUpMpRqwGLdp3S8SeKgCcIVQrADaJdCNGwAJozCMiWvaQ0BGAEw9YAZgC6fc-isBWO-4AMz7Xo1rbzt7XxdXK29g2B9Hf3Q_cwpqOmYIaA5_LhJEgyNGAC1gYABbYX88YyUwADVpCSDuFC4AbiA
### Steps to Reproduce
```js
option = {
xAxis: {
type: 'value'
},
yAxis: {
type: 'value'
},
series: [
{
data: [
[12, 3],
[15, 50],
[20, 30],
[100, 50]
],
type: 'line'
}
],
dataZoom: {
startValue: 20
}
};
```
### Current Behavior
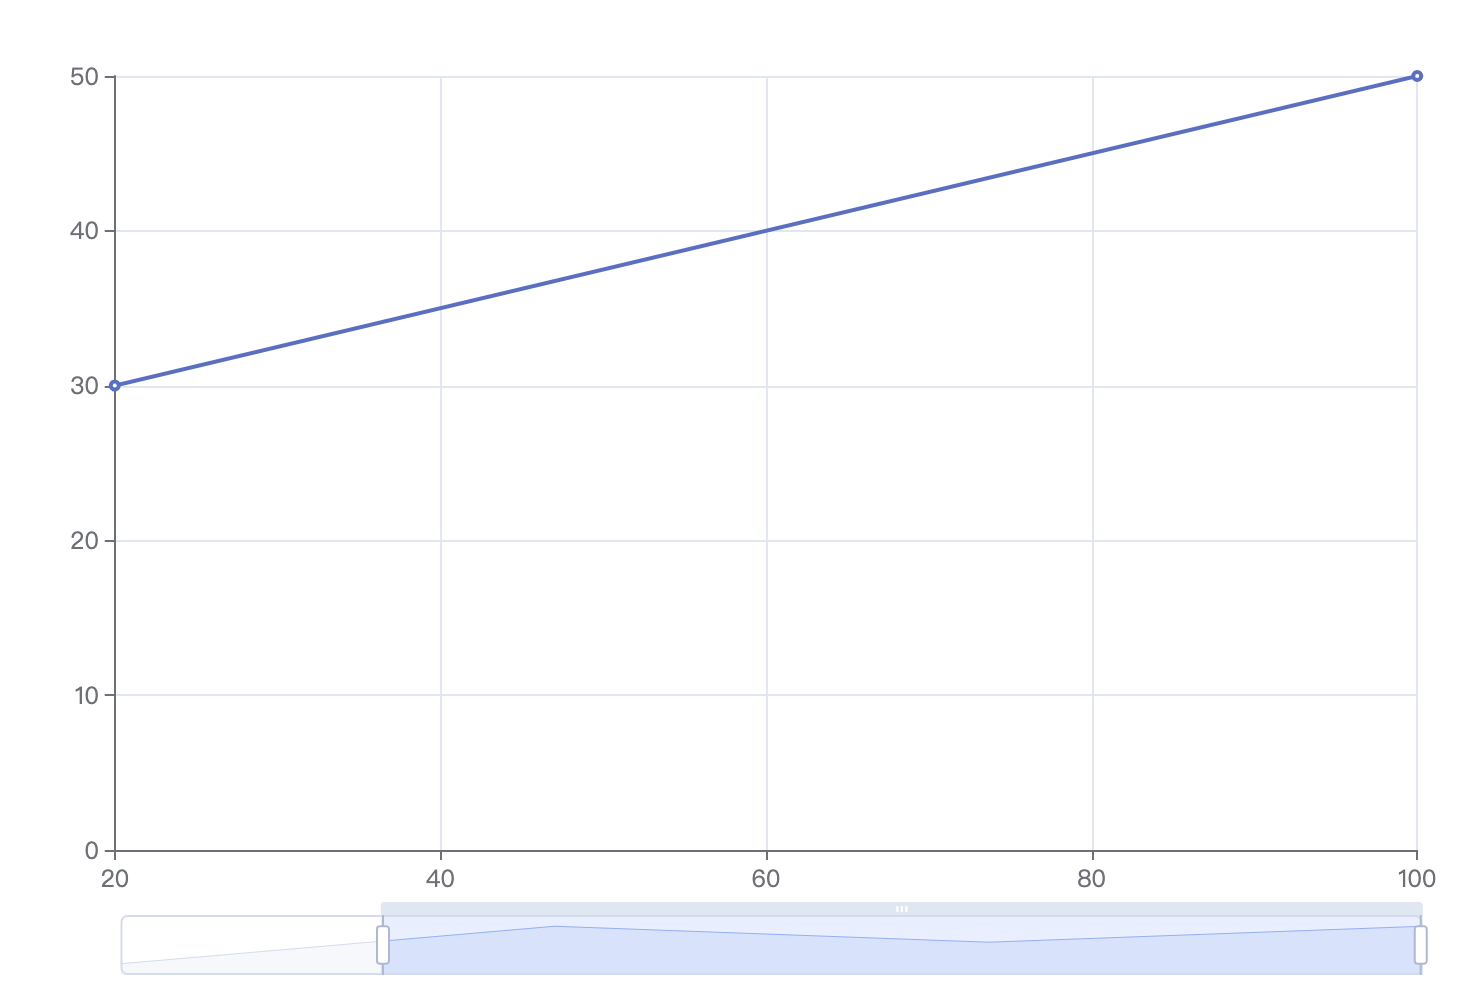
The *detail* view in the dataZoom is not the same as the data in range. You can see that the max value is still in the detail view of the dataZoom (wrong) but not in the chart visible area (correct).
### Expected Behavior
The detail view should be the same as the chart area.
### Environment
```markdown
- OS:
- Browser:
- Framework:
```
### Any additional comments?
Similar problems exists when data is not in the ascending order in xAxis (e.g., [100, 10], [50, 20]).
Contributor guide
Assessment
This issue has not been assessed yet.