[Bug] Performance under dynamic update of massive data
- Dominant language
- TypeScript
- Stars
- 67.3k
- Forks
- 19.8k
- Avg merge
- 11d 14h
- Merged PRs (30d)
- 8
Description
### Version
5.3.2
### Link to Minimal Reproduction
https://stackblitz.com/edit/web-platform-2anuwg
### Steps to Reproduce
1. create a chart with `5 xAxis`, `5 yAxis`, `8 series(1 candlestick, 2 bar, 5 line)`, `1 dataset(13306 length)`;
2. Add one piece of data every 500ms;
> demo index.html:396
```typescript
setInterval(() => {
myChart.setOption({
dataset: [
{
source: getDataSource(),
seriesLayoutBy: 'column'
},
],
});
}, 500);
```
### Current Behavior
### Charts become stuttering and dropped frames.
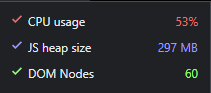
👉 Very high performance overhead
> Chromium Devtools Performance monitor
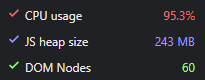
👉 Especially when dragging the chart left and right
> Chromium Devtools Performance monitor
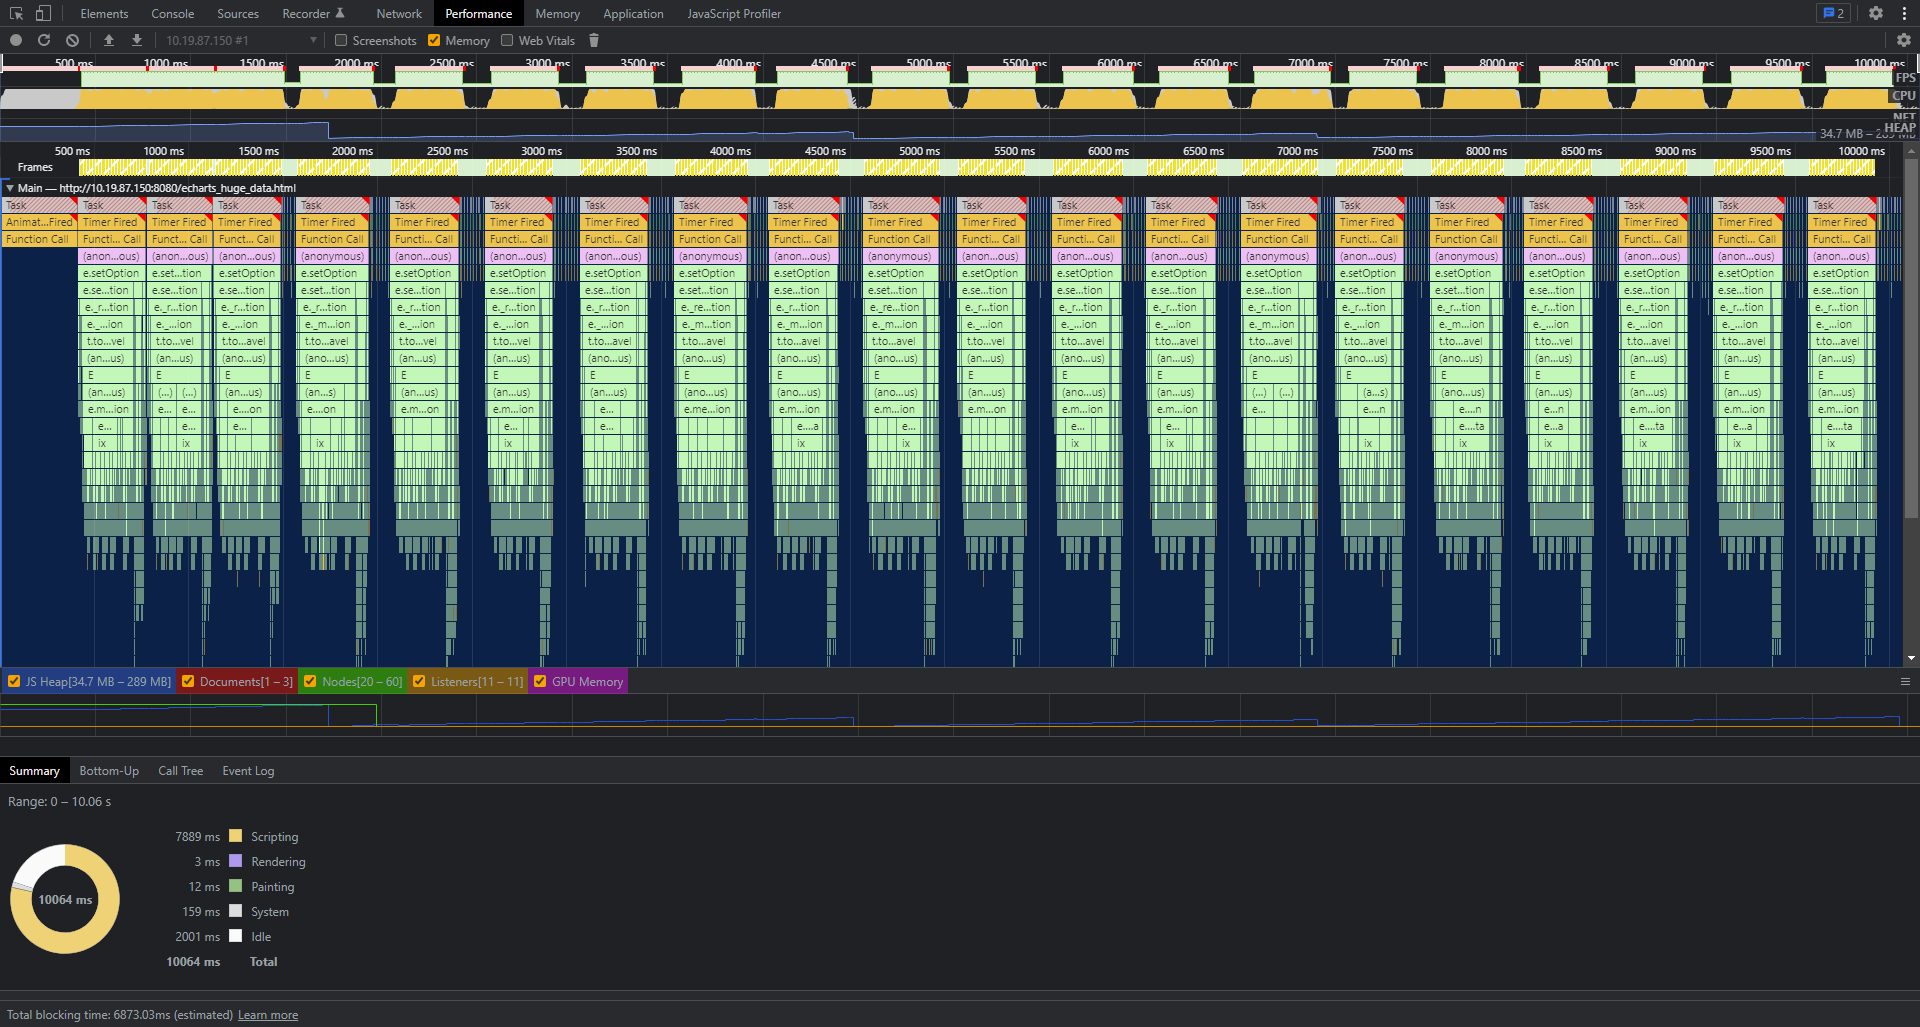
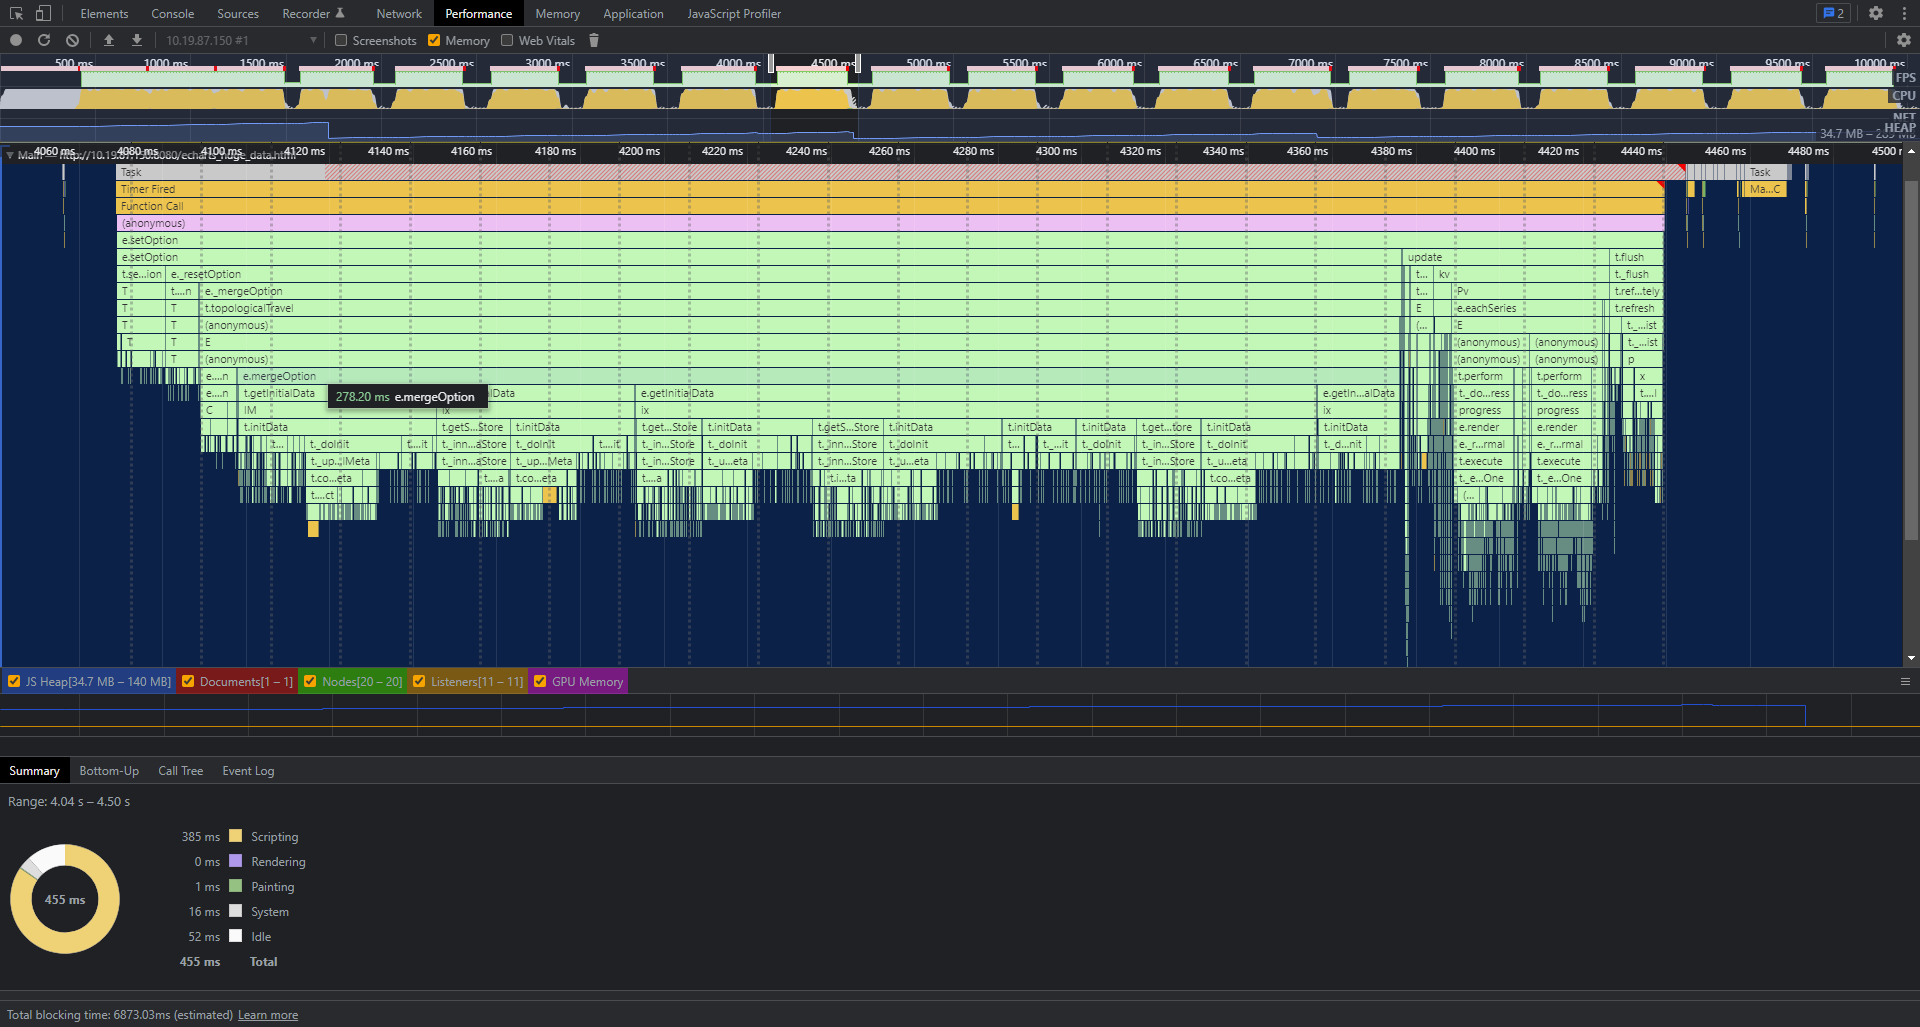
👉 Every update takes at least 400ms.
> Chromium Devtools Performance log
### Expected Behavior
### Smooth dragging and lower performance overhead
Dataset source can be updated incrementally
### Environment
```markdown
- OS: Windows 10 Pro 21H2
- Browser: Google Chrome 100.0.4896.75
- Framework: Angular@11.2.4
```
### Any additional comments?
Echarts is used to display the k-line and several studies(Volume, RSI, MACD, KD) in my real business scenario.
The latest data is updated every 500ms and the indicators are recalculated last each time.
Contributor guide
Assessment
This issue has not been assessed yet.