[Bug] only one point in chart y-axis doesn't show coordinates
- Dominant language
- TypeScript
- Stars
- 67.3k
- Forks
- 19.8k
- Avg merge
- 11d 14h
- Merged PRs (30d)
- 8
Description
### Version
5.3.0
### Link to Minimal Reproduction
https://echarts.apache.org/examples/en/editor.html
### Steps to Reproduce
1. use option like this
```js
option = {
xAxis: {
type: 'time',
minInterval: 3600 * 23 * 1000,
axisLabel: { formatter: '{yyyy}-{MM}-{dd}', hideOverlap: true }
},
yAxis: [
{
type: 'value'
}
],
series: [
{
data: [['2021-12-31', 10]],
type: 'line'
}
]
};
```
3. xAxis don't show the coordinates '2021-12-31', and occur condition:
1) only one point and is the last day of the year
2) xAxis: set minInterval is one day (3600 * 24 * 1000),set type is 'time'
if you change any other day like '2021-12-30', the coordinates of xAxis will appear。

wrong situation
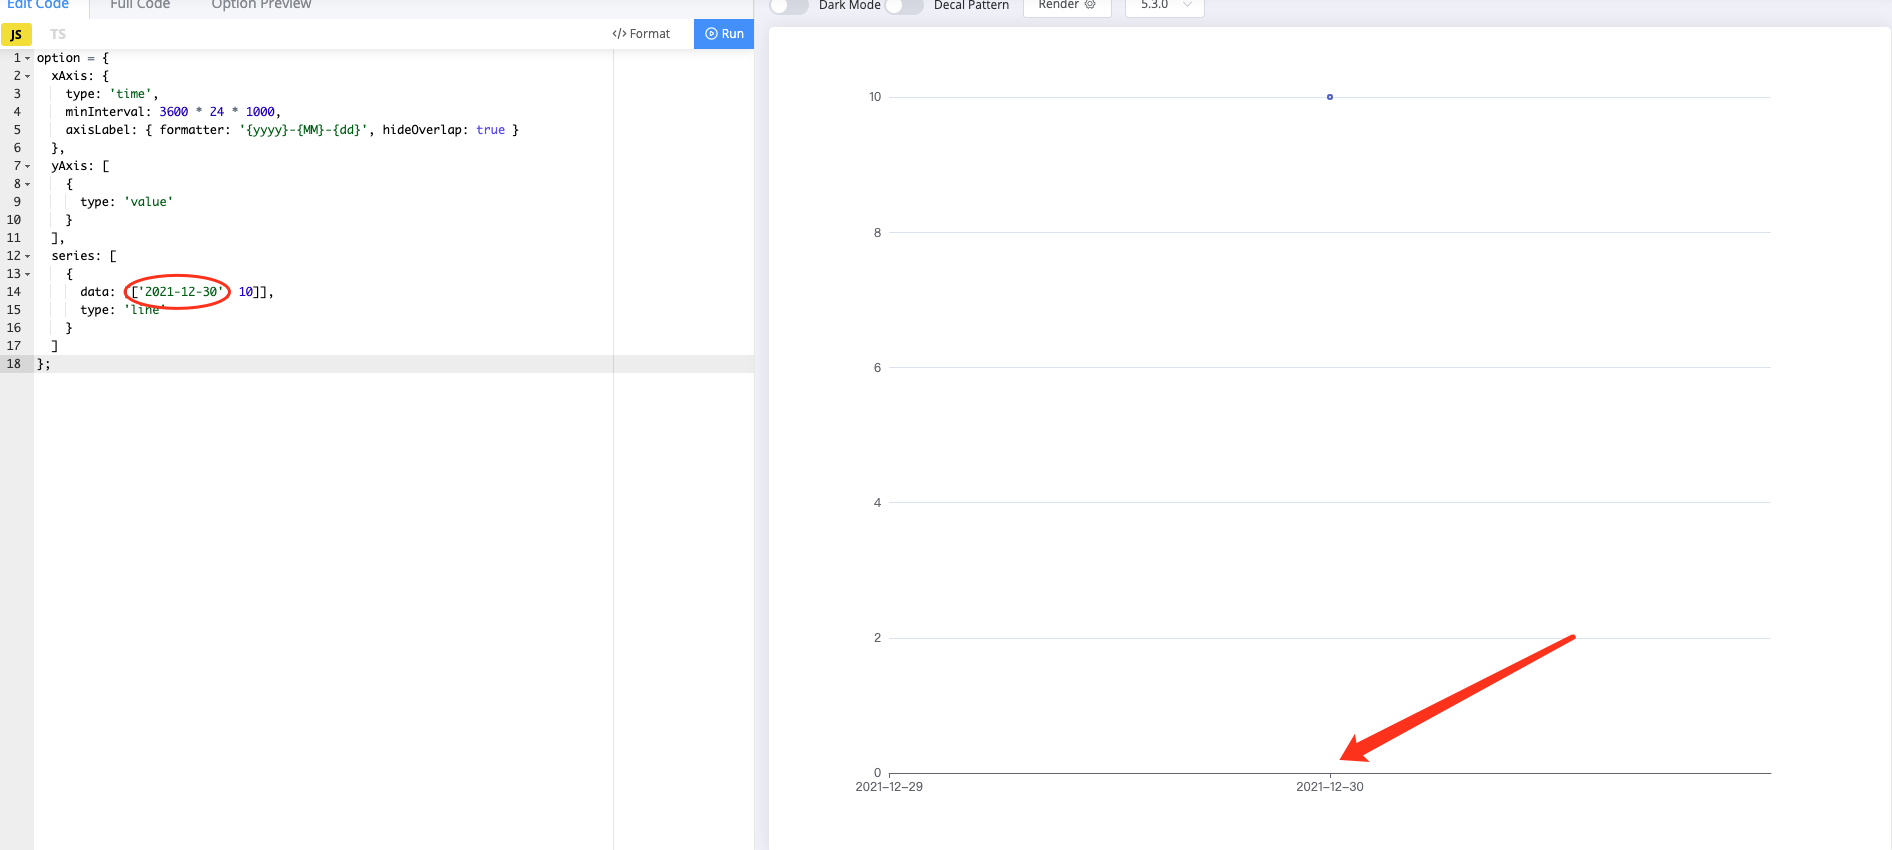
normal condition
### Current Behavior
don't show coordinates of date
### Expected Behavior
hope can show the coordinates of date
### Environment
```markdown
- OS:macOS Big Sur
- Browser: Chrome ~92
- Framework:React
```
### Any additional comments?
_No response_
Contributor guide
Assessment
This issue has not been assessed yet.