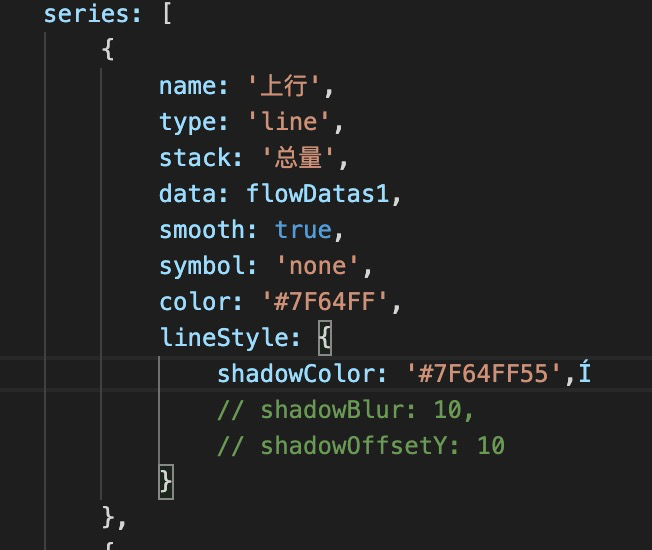
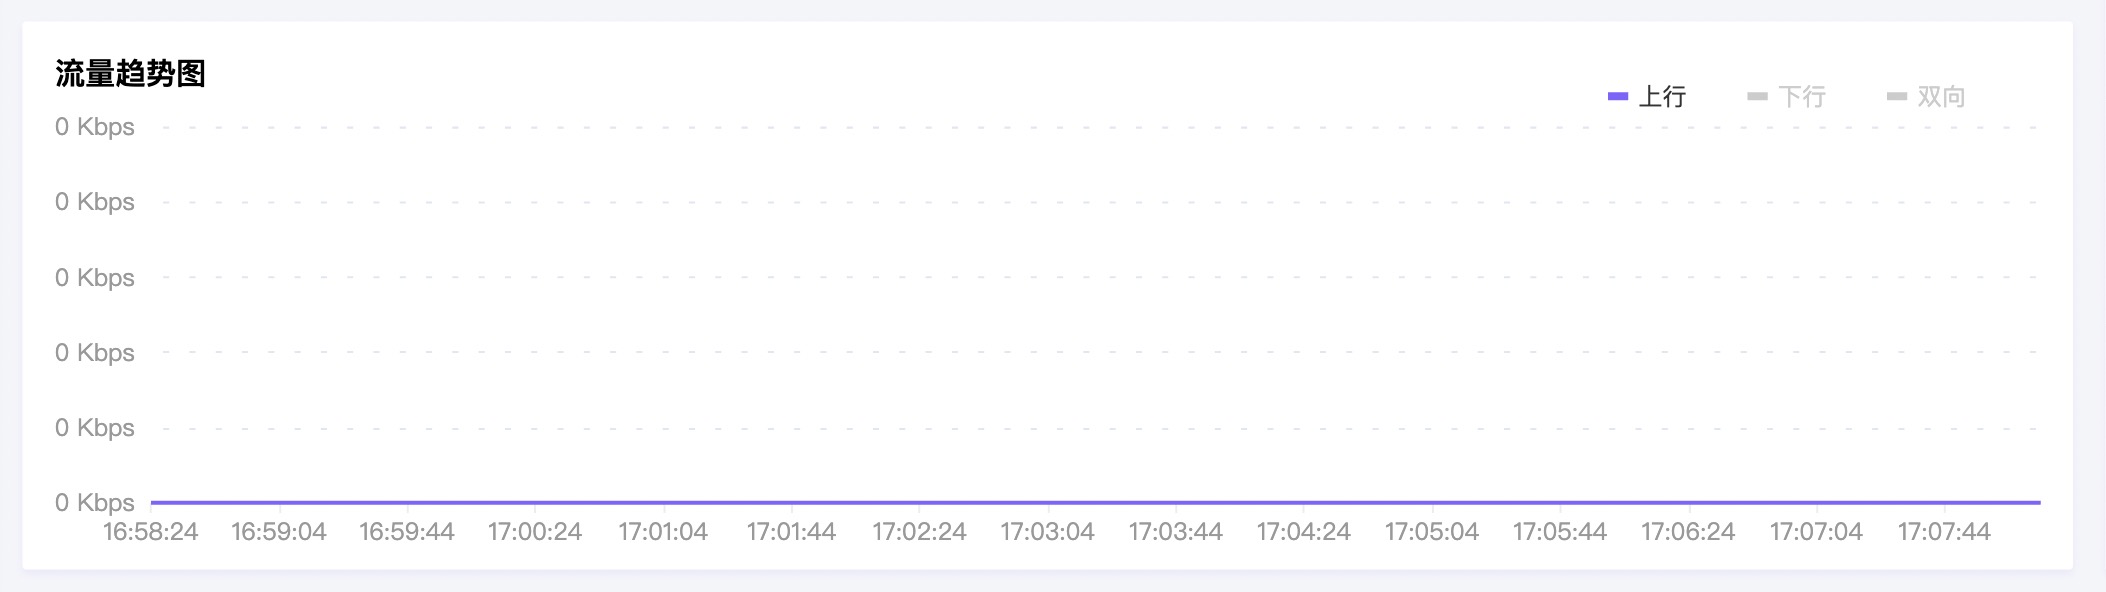
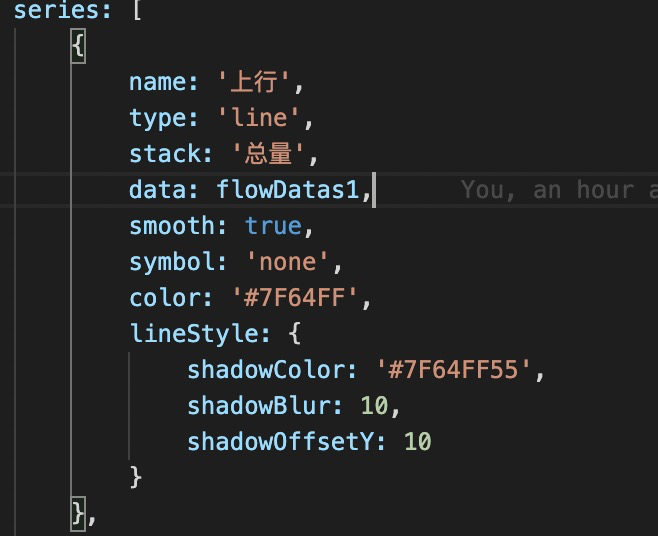
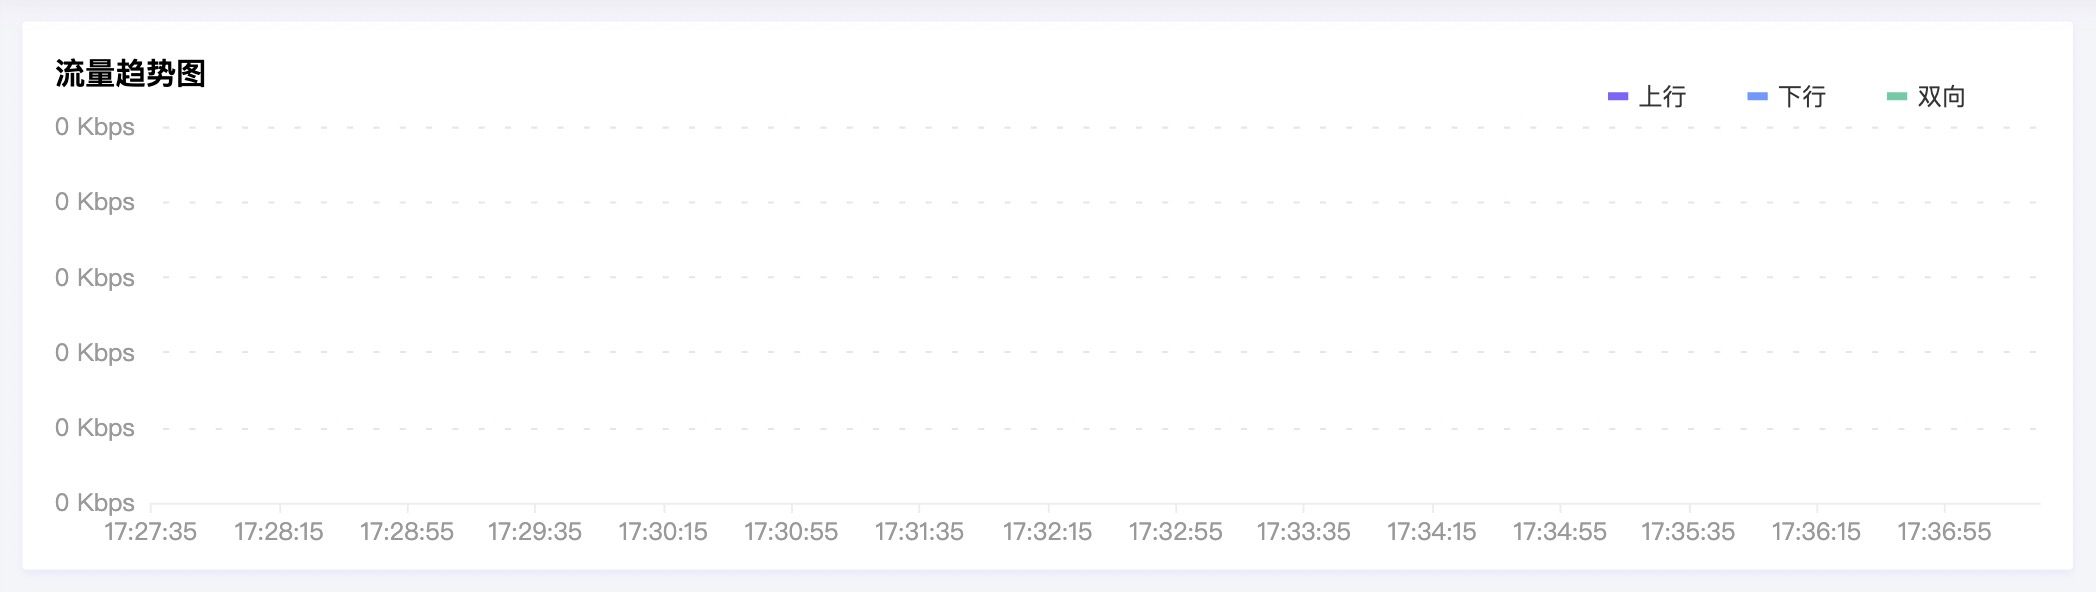
svg模式下,折线图在数据都为0的情况下,设置shadowOffset或shadowBlur会导致折线不显示
- Dominant language
- TypeScript
- Stars
- 67.3k
- Forks
- 19.8k
- Avg merge
- 15h 17m
- Merged PRs (30d)
- 5
Description
### Version
5.1.2
### Steps to reproduce
1.renderer设置为svg
2.正常设置折线图
3.折线图数据value值都为0
4.series中给lineStyle设置shadowoffset或shadowblue
A simple demo
```js
option = {
xAxis: {
type: 'category',
data: ['Mon', 'Tue', 'Wed', 'Thu', 'Fri', 'Sat', 'Sun']
},
yAxis: {
type: 'value'
},
series: [{
data: [0, 0, 0, 0, 0, 0, 0],
type: 'line',
stack: true,
color: '#7f64ff',
symbol: 'none',
smooth: true,
lineStyle: {
shadowColor: 'red',
shadowBlur: 5,
shadowOffsetX: 0,
shadowOffsetY: 0
}
}]
};
```
### What is expected?
线条正常在底部显示
### What is actually happening?
线条不显示
Contributor guide
Research direction
Start by running the provided ECharts option with the SVG renderer, using all-zero line data and the shown shadow settings. Compare the result with the expected chart and trace the SVG line rendering behavior; done means the line is visible at the bottom under these conditions.
Written by the indexing model from the issue text.
Assessment
- Tech stack
- typescript
- Domain
- data-visualization
- Issue type
- Bug
- Difficulty
- 3/5
- Estimated time
- 1-2 days
- Activity status
- Stale
- Clarity
- Mostly clear
- Newbie friendliness
- 35/100